Acceptance testing and routine testing of Dual Head SPECT Gamma Camera at a new cancer hospital
Kashif Islam*, Sohail Murad, Saif-ul-Haque, Muhammad Sajjaj Siraj, and Ahmad Qureshy
Published Date: 2022-09-28DOI10.36648/2574-285x.7.5.22
Kashif Islam1*, Sohail Murad1 , Saif-ul-Haque3, Muhammad Sajjaj Siraj4, and Ahmad Qureshy4
1Department of Medical Physics, Gujranwala Institute of Nuclear Medicine and Radiotherapy (GINUM), Gujranwala, Pakistan
2Director, Gujranwala Institute of Nuclear Medicine and Radiotherapy (GINUM), Gujranwala, Pakistan
3Department of Nuclear Medicine, Nuclear Medicine Oncology and Radiotherapy Institute (NORI), Islamabad, Pakistan
4Department of Medical Physics, Gilgit Institute of Nuclear Medicine, Oncology and Radiotherapy (GINOR), Gilgit, Pakistan
- *Corresponding Author:
- Kashif Islam
Department of Medical Physics,
Gujranwala Institute of Nuclear Medicine and Radiotherapy (GINUM), Gujranwala,
Pakistan,
E-mail: kashif.iislam@gmail.com
Received date: September 2, 2022, Manuscript No. IPIMP-22-14331; Editor Assigned date: September 6, 2022, PreQC No. IPIMP-22-14331(PQ); Reviewed date: September 16, 2022, QC No. IPIMP-22-14331; Revised date: September 23, 2022, Manuscript No. IPIMP-22-14331 (R); Published date: September 28, 2022, DOI: 10.36648/2574-285x.7.5.22
Citation: K Islam, Haque S, Siraj MS, Murad S, Qureshy A (2022) Acceptance Testing and Routine Testing of Dual Head SPECT Gamma Camera at a New Cancer Hospital. J Med Phys Appl Sci Vol.7 No.5:22.
Abstract
Aim: Here, we report acceptance testing and the first routine testing of a dual head SPECT gamma camera installed in a remote cancer hospital. Routine testing was performed one and half year after commissioning.
Material and Methods: Acceptance test procedures were performed according to the instructions and guidelines of the manufacturer. Co-57 and Technitium-99m (Tc-99m) flood sources and Tc-99m point sources were used. Low Energy High Resolution (LEHR) and Low Energy General Purpose (LEGP) collimators were used for a range of acceptance and routine tests. Results: All the acceptance tests including energy calibration, extrinsic uniformity (with LEGP, LEHR collimators), intrinsic spatial linearity, quadrant bar phantom study, count rate performance test, system sensitivity, COR at 90°, 102° and 180° detector configuration, intrinsic energy resolution and Jaszczak study passed. However, uniformity calibration and test with Tc and I-131 sources did not pass alongwith spatial resolution of whole body and spatial resolution without scatter with LEHR. After installation and acceptance tests, the system has been kept in standby mode until the completion of other radiological installations within the hospital, and the routine testing was performed before the commencement of patient services in the cancer hospital.
Conclusion: The uniformity tests passed when the comparison is made with IAEA recommended guidelines.
Keywords
Flood field uniformity; Acceptance testing; Routine testing; Image processing; ImageJ
Introduction
The most widely used instrument in nuclear medicine for the evaluation of the function or diagnosis of pathologies is a gamma camera. It is used for bio-distribution imaging by performing dynamic and static studies of biological tissues [1,2]. The functional information from gamma camera is overlapped with the information of anatomy and internal structures obtained through X-ray and CT installed on the same equipment [3]. Single Photon Emission Computed Tomography (SPECT) images obtained from gamma camera provide improved disease localization [4].
The performance of cameras may vary due to characteristics of the detector crystal. Gamma camera detectors are commonly made of hygroscopic NaI crystal or Cadmium-Zinc-Telluride (CZT) [5,6]. Poor ambience or environment may have an influence on the performance characteristics of gamma camera [7].
Diagnostic imaging quality and optimized radiation doses of radiopharmaceuticals to patients are ensured through a quality assurance program and monitoring of equipment performance. Routine quality control, calibration and performance testing of gamma cameras are necessary in order to consistently acquire good quality images without artifacts. The QA of gamma camera consists of a number of tests proposed by international organizations such as IAEA and AAPM [8,9]. Acceptance testing of gamma camera provides baseline data for the performance evaluation and ensures that the instrument meets the end-user requirements for the manufacturer in relation to safety, damages, or deficiencies, compromising clinical studies [10-12]. Planar and rotational uniformity test, spatial resolution test, and center of rotation test are important tests for dual head SPECT gamma cameras [13,14]. A complete list of gamma camera acceptance tests is given in references [15,16].
The uniformity of the gamma camera refers to its ability to produce a uniform image when detector is irradiated with uniform flux of radiations. Flood field uniformity may be quantified as the degree of uniformity exhibited by the detector itself (intrinsic uniformity) or by the detector with collimator mounted (extrinsic uniformity). It may be quantified in terms of the maximum variation in count density over the entire field of view (integral uniformity) or in terms of the maximum rate of change of count density over a specified distance (differential uniformity) [17]. The factors affecting intrinsic uniformity are gamma source activity, acquired counts for the flood image, image matrix size, and source volume[18,19]. The use of software is becoming common for quality control of images from a gamma camera. In a study, NMQC software from IAEA was used to perform image analysis of ten non-uniform QC images from a gamma camera [20].
There are several ways to characterize the spatial resolution in a gamma camera. The Point Spread Function (PSF) and Line Spread Function (LSF) are the profiles of measured counts as a function of position across the point or line source of a detector. The Full Width at Half Maximum (FWHM) and Full Width at Tenth Maximum (FWTM) are used to describe the profile widths [21]. One of the factors affecting the spatial resolution in nuclear medicine imaging system is collimator because it limits the direction of γ-rays incident on the detector. Collimators are designed for specific purposes (e.g., sensitivity, resolution and specific radionuclides). The hole size and spacing of a collimator affects the spatial sampling; therefore, each collimator leads to a different system spatial resolution [21].
The bar phantom is placed on the collimator and the flood source is placed on top of the bar phantom for the determination of extrinsic resolution of a gamma camera. A 10M count image of the bar phantom is acquired and evaluated visually to check the detector resolution and linearity. For intrinsic resolution, the bar phantom is directly placed over the detector without collimator. A Tc-99 m point source is placed at 5 FOV distance. As a rule of thumb, the intrinsic resolution of a detector in terms of the Full Width at Half Maximum (FWHM) of the line spread function can be approximated as FWHM ≈ 1.7Sb, where Sb is the size of the smallest resolvable bars [21].
Nuclear medicine images are noisy because of limited safe amount of injected activity and the optimized scan duration without inflicting patient disocmfort or without causing physiological changes due to activity distribution. In areas of low uptake or low contrast, noise in the image affects both qualitative and quantitative accuracy. The response of a system to a specific amount of activity is reflected in its sensitivity [21].
The dead time is the length of time required for a counting system to record an event, during which additional events cannot be recorded. The radiation detectors have a finite dead time typically 5 μs - 10 μs for modern scintillation detectors. In modern scintillation detectors automated algorithms yield count rates corrected for dead time count losses. These scintillation detectors based systems, such as well counters, γ cameras and PET scanners follow paralysable models. In a paralysable detector, even radiation which is not counted, interacting with the detector during the dead time of a previous event, prevents counting of subsequent incoming radiations during the time interval corresponding to its dead time [21].
The detector heads of a SPECT gamma camera need to be perfectly oriented parallel to the z axis of the system, such that each angular view is imaging the same volume. The centre of each angular projection should be consistent with the centre of mechanical rotation. Errors due to these factors can potentially lead to a loss of spatial resolution and the introduction of image distortion or ring artefacts. These issues can be identified and corrected with centre of rotation procedure by employing a small point source in the camera’s FOV at an off-centre location. SPECT data acquisition is performed and deviations from the expected sinusoidal pattern are measured in the resulting sonograms [21].
Jaszczak phantom study is performed to evaluate the overall performance and the impact of reconstruction filters on resolution during acceptance and routine testing of the SPECT systems [21].
In our work, the acceptance tests included uniformity (intrinsic and extrinsic) with Tc-99m and I-131 sources For Low Energy High Resolution (LEHR) and Low Energy General Purpose (LEGP) collimators, COR at 90°, 102° and 180°, spatial linearity, spatial resolution, energy resolution, system sensitivity of Head 1 & 2 with LEHR collimator, whole body spatial resolution, Jaszczak and count rate performance tests.
Materials and Methods
Installation and commissioning of Dual Head SPECT Gamma Camera (Anyscan S Mediso Nucline, AS-909279-S) with standard 9.5 mm thick NaI crystal head containing 60 # of PMTs was performed at a remote hospital. Factory tests were performed by following NEMA standards NEMA NU 1-2012 at Laborc u. 3.H-1037 Budapest Hungary.
The radioactive materials used were Technetium (Tc-99 m), Cobalt-57 (Co-57), Iodine (I-131) and Barium-133 (Ba-133). Low energy photons were used from Tc-99 m and Co-57 and high energy photons were used from I-131 for uniformity evaluations. Ba-133 was used for random checking of detector and random peaking.
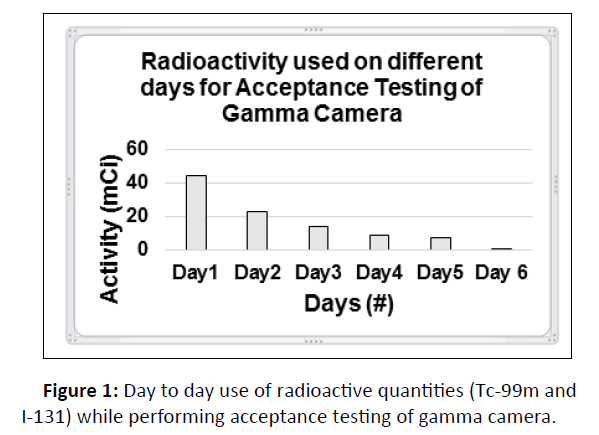
The day to day use of radioactive sources (Tc-99 m and I-131) has been given in Figure 1 during acceptance testing of Gamma Camera. All the radioactive sources were transported from other nuclear medicine center. However, I-131 was used just for a single day to perform uniformity calibration and the relevant test (Figure 1).
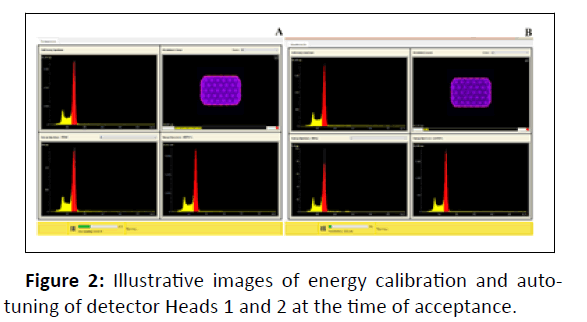
At the end of acceptance tests, the surfaces of tables and stands were decontaminated. The motion and axial calibrations of gamma camera were performed followed by energy calibration and auto-tuning of detectors.
Energy and intrinsic uniformity calibration
After energy calibration with Tc-99m and I-131, the uniformity calibration and tests were performed with respective radioactive sources. Uniformity is performed either intrinsically (without collimator) or extrinsically (with collimator).
Soon after intrinsic uniformity calibration, intrinsic uniformity test was performed with I-131 and Tc-99m. Total counts of 40,000 were collected at count rate of 35 kcps by placing Tc-99m source at a distance of 5 FOV. The gamma camera detector configuration used in this case was 102°. Acquisition was performed from NM tests protocol of acquisition system. The results obtained were compared with the reference values obtained during factory settings.
The acquired uniformity images were processed with ImageJ software for any non-uniformity with a grid size 512 x 512, smoothing 100% for 3D surface profile in image processing software. The processed profiles of images were found relatively uniform.
Extrinsic uniformity with Co-57, Tc-99m, LEGP, LEHR
Extrinsic uniformity tests were performed to collect data for the documentation of differential and integral uniformities. Extrinsic calibration and the relevant test were performed with Tc-99 m and Co-57 flood sources. Extrinsic calibration & test were performed with Tc-99m and Low Energy General Purpose (LEGP) and Low Energy High Resolution (LEHR) collimators. The collimators may be kept installed on the detectors. The refillable flood source was filled with Tc-99 m activity (12.5 mCi for LEGP and 20 mCi for LEHR) and placed on the detector with collimator mounted on detector heads. Energy and uniformity calibration protocol was selected and run from the service menu of image acquisition system of gamma camera. On completion of acquisition, the energy and uniformity tables were automatically calculated. For Co-57 flood source, LEHR collimator was installed too.
Intrinsic Spatial Linearity of detector 1 & 2
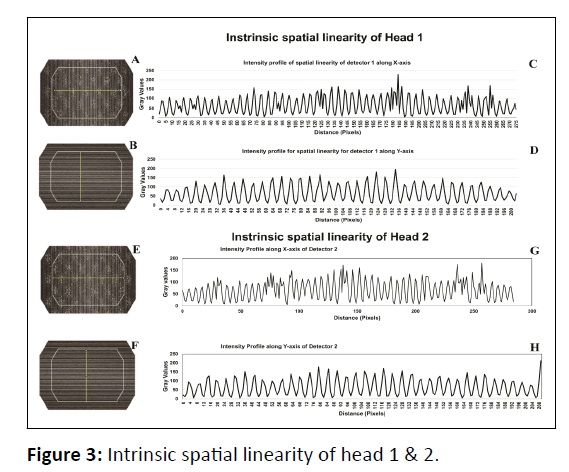
A source of 100 MBq with a count rate of 30 kcps was used to collect data with 30% energy window. The source was placed in a source holder covered with copper plates. The radiation falls on Linearity phantom having 10mm slit spacing fixed over a gamma camera configured at 102°. Also the camera was set at 0 degrees for Det#1 (Detector at bottom) for safety, then bolted down before rotating the camera and fixing of collimator connections was done before installing the linearity mask.
Quadrant bar phantom study
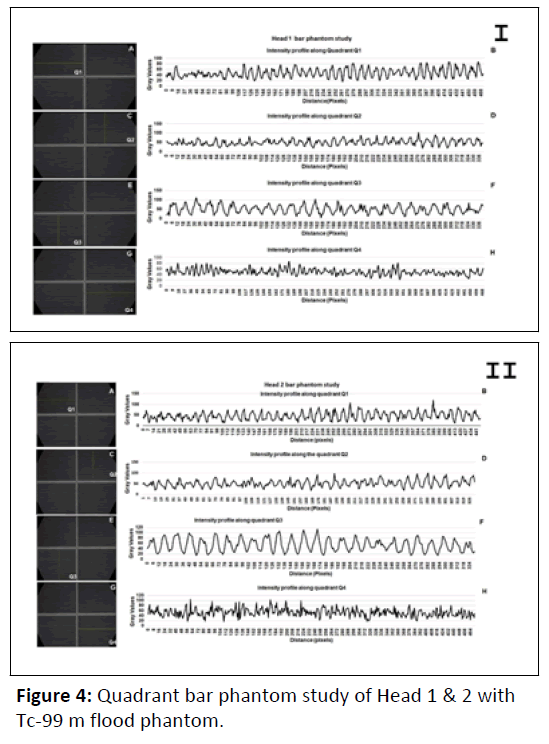
The bar phantoms are made of lead strips embedded into plastic and typically arranged in four quadrants. The lead strips are radio-opaque, while plastic strips are radio-lucent. Each quadrant has strips of different thickness. The rectangular bar phantom image has four quadrants with strip sizes of 2.0mm, 2.5mm, 3.0mm and 3.5 mm. A radioactive source Tc-99m with an activity of 35 MBq was used. A total of 8 m counts were collected at a count rate of 20 kcps with 102° detector configuration.
Count rate performance test
The Tc-99m source of 10 MBq with a count rate of 60 kcps gradually and slowly moved from 5 FOV (2 m-3 m) towards the center of a gamma camera detector configured at 102 degrees. While approaching towards the center of detector, the count rate is noted from the touch screen. This activity was performed by the first person. The count rate increases continuously when the source comes towards the center. The source movement was stopped with the help of second person who handles the software by starting and stopping the program.
System sensitivity
Tc-99 m source of 1 mCi was prepared. The measurement time and the amount of activity were recorded. The source was placed at the center of the collimator. A special source holder was used to proceed with the test. A 60 second acquisition was performed for both detector heads. While processing of data, data field were entered such as isotope preparation time and activity. The results were calculated and compared with gamma camera specifications.
COR at 90, 102 and 180-degree detector configuration
A special source holder is pulled out and 0.5 ml Tc-99m (300 MBq) is placed in a 2 ml syringe while the detector is at 180 detector configuration. The source has to be in the same position during the whole procedure. The process is quite the same for all detector configurations such as COR-90, COR-102 and COR-180, only the detector configuration changes. The frame time is set in the ‘SPECT Options’ window and 120.000 counts per projection were collected as per NEMA recommendation.
Spatial resolution of whole body
Two Tc-99m line sources (capillary tubes each of) 100 mm were placed parallel to each other and 50 mm apart from each other. The distance was set to 100 mm between the capillary tube and the upper collimator surface by setting patient table height and/or upper detector radius. The patient table was moved in opposite direction of examination and the screen was kept in view until the second capillary tube disappeared from the detector screen. The detector configuration was set at 180°.
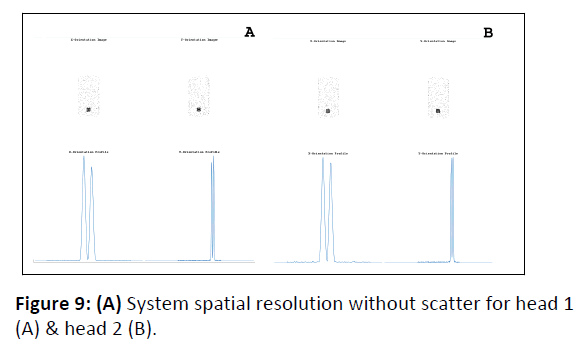
Spatial resolution without scatter with LEHR
Two line sources of Tc-99m (each of 600 MBq) were used to collect 1.5 Million counts with 180° configured gamma camera. The sources were of 100 mm lengths, 1 mm diameter and were separated from each other with a distance of 50 mm.
Energy resolution
Energy resolution requires Tc-99m 5-6 MBq with a count rate of rate 30kcps while the detector configuration is 102° for gamma camera. One copper plate with the thickness of 2 mm was used for the radiation scatter. It is important that in the spectrum the peak center must be on the right place. The peak centering was done by using autopeak.
Jaszczak Phantom test
Jaszczak phantom study was performed by adding 20 mCi activity to the Jaszczak phantom. The data was acquired with the help of acquisition software of Mediso gamma camera. The resulting images were processed with the help of processing software provided by Mediso. The images were further analyzed with ImageJ software.
Results
The system was powered up. Energy calibration and autotuning of detectors 1 and 2 were successfully performed and the energy spectra of PMTs while performing the above test are presented in Figure 2 A,B. An average FWHM value of five values is calculated with the processing software provided by the manufacturer. This average value is compared with NEMA specification. The peak value was found at 140.5 keV and the difference between the five values of the peaks was less than 0.3 keV (Figure 2).
Intrinsic uniformity calibration and tests of detectors were performed with Tc-99m and Iodine-131 radioactive sources. The differential and integral uniformity values of CFOV and UFOV were compared with reference values obtained from manufacturer. For I-131 flood source, all values were slightly higher than the reference values. However, for Tc-99 m flood source, at the time of installation, all values were higher than the reference values except the integral CFOV, which was below the limit for uniformity of detector 1 & 2. The value of integral CFOV uniformity raised at the time of routine testing started after a period of more than one year. So, the acceptance values of intrinsic uniformity tests did not pass for I-131 and Tc-99m sources (Table 1).
| Reference For factory testing values (%) |
Acceptance testing with I-131 | Acceptance testing with Tc-99 m | NEMA Specification Values (%) | Routine testing with Tc-99 m | ||||
|---|---|---|---|---|---|---|---|---|
| D1 | D2 | D1 | D2 | D1 | D2 | |||
| Differential CFOV | ≤ 1.5 | 1.9 | 1.7 | 1.7 | 1.8 | 3 | 1.8 | 1.7 |
| Differential UFOV | ≤ 1.5 | 1.9 | 1.9 | 1.8 | 1.9 | 3 | 1.8 | 2.2 |
| Integral CFOV | ≤ 2.0 | 2.4 | 2.1 | 1.9 | 1.9 | 3.6 | 2.4 | 2.2 |
| Integral UFOV | ≤ 2.0 | 2.5 | 2.3 | 2.3 | 2.1 | 3.6 | 2.4 | 2.6 |
Table 1: Acceptance testing and 1st routine testing results of Intrinsic Flood Field Uniformity for Detector 1 and 2 with Iodine-131 and Tc-99m point source.
When gamma camera is new, then intrinsic uniformity is performed on routine basis. However, when camera becomes old then removing the collimator becomes an operational risk.
Therefore, extrinsic uniformity is preferred over intrinsic uniformity. Furthermore, this test is also used to assess the collimator integrity. The values in extrinsic mode are given (Table 2).
| Acceptance values | Routine testing values | |||||||||||
|---|---|---|---|---|---|---|---|---|---|---|---|---|
| Reference values (%) | Co-57 with LEHR | Tc-99 m with LEGP | Tc-99 m with LEHR | NEMA values (%) | Tc-99 m with LEGP | Tc-99 m with LEHR | ||||||
| D1 | D2 | D1 | D2 | D1 | D2 | D1 | D2 | D1 | D2 | |||
| Differential CFOV | ≤ 1.5 | 2.4 | 2.5 | 2 | 1.7 | 1.6 | 1.8 | 3 | 2 | 2.3 | 1.8 | 2.4 |
| Differential UFOV | ≤ 1.5 | 2.9 | 2.6 | 2 | 1.7 | 2.2 | 2 | 3 | 2 | 2.3 | 1.8 | 2.5 |
| Integral CFOV | ≤ 2.0 | 3.9 | 3.7 | 2.5 | 2.1 | 2.3 | 2.3 | 3.6 | 1.7 | 2.2 | 1.8 | 2.2 |
| Integral UFOV | ≤ 2.0 | 5.5 | 5.1 | 2.6 | 2.1 | 2.5 | 2.4 | 3.6 | 2.2 | 2.6 | 1.8 | 2.2 |
Table 2: Acceptance testing and routine testing results of extrinsic flood field uniformity of Detector 1 and Detector 2 with Co-57 (LEHR) and Tc-99m (LEHR & LEGP collimators) flood source.
All uniformity values were observed to be higher than reference values at the time of acceptance. Whereas, the values of routine test were within the acceptable limits if compared with reference values given in [21].
Visual inspection of linearity along X-axis of both detectors indicates distortion in linearity (Figure 3) but within the acceptable limits of manufacturer. Therefore, the absolute UFOV linearity along X-axis of detector 1 and 2 is 0.31 and 0.38 respectively (Table 3).
| Measured values for detector 1 | Measured values for detector 2 | ||||
|---|---|---|---|---|---|
| Reference values (mm) | X-axis (mm) | Y-axis (mm) | X-axis (mm) | Y-axis (mm) | |
| Absolute Spatial Linearity | |||||
| CFOV | ≤ 0.36 | 0.16 | 0.28 | 0.09 | 0.22 |
| UFOV | ≤ 0.38 | 0.31 | 0.28 | 0.38 | 0.22 |
| Differential Spatial Linearity | |||||
| CFOV | ≤ 0.18 | 0.03 | 0.03 | 0.02 | 0.02 |
| UFOV | ≤ 0.19 | 0.03 | 0.03 | 0.04 | 0.03 |
Table 3: Intrinsic spatial linearity for detector 1 and detector 2.
In a quadrant bar phantom, white lines correspond to the plastic strips while black lines correspond to lead strips. The strips are separated with the same distance as the strip width.
Quadrants Q1 & Q3 of detector 1 and 2 indicate distinct patterns given in Figure 4 I & II (A, C, E). These patterns are formed due to equidistant bars, separated by 2.5, 3.0 and 3.5mm. The bars of 2.0 mm cannot be resolved by the system, (Figure 4 I & II) (H). The profiles of quadrant lines had been processed with ImageJ software and shown in Figure 4 I &II (B, D, F, H).
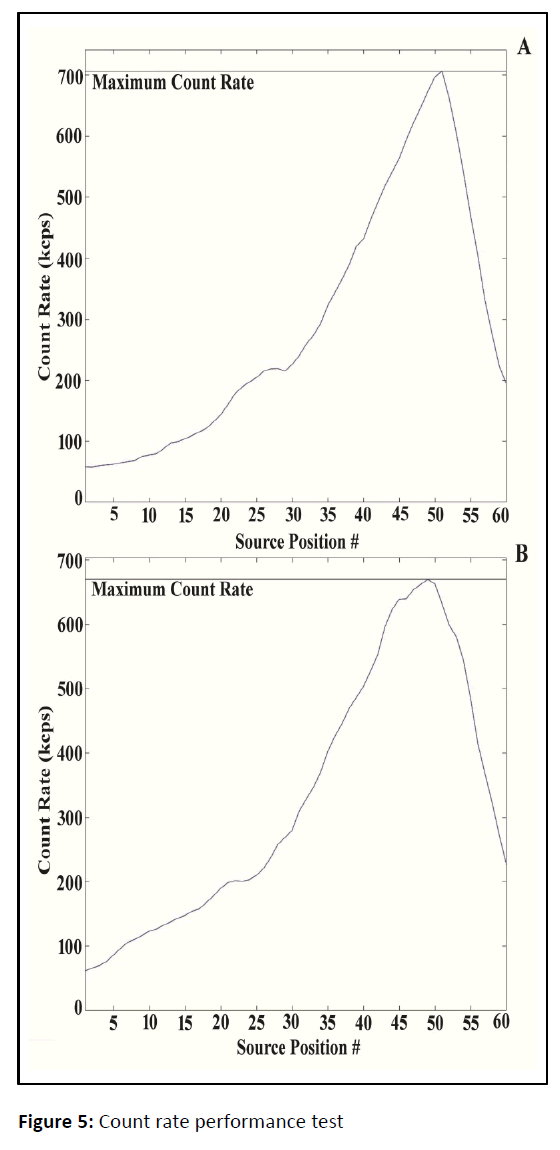
The count rate recorded during acceptance testing of detector heads indicates that the detectable rate is quite high for detector 1 whereas the detection rate is relatively lower in case of detector 2 (Figure 5 A,B, Table 4 & 5). The curve rises smoothly and steadily until it reaches its maximum, then starts decreasing continuously.
| Reference | Detector 1 (kcps) | Detector 2 (kcps) |
|---|---|---|
| On site (acceptance test) | 706 | 670 |
| Factory test | 739 | 698 |
Table 4: Count rate performance test.
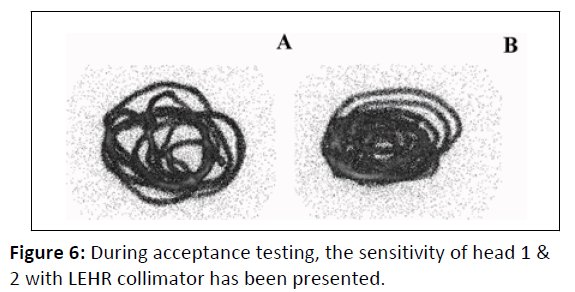
Sensitivity test of both detector heads (1 & 2) was performed at the time of acceptance and routine testing. The outcome of acceptance test was found within limits whereas the values for routine test were on higher side. The resulting values found have been recorded in Table 5 and the recording pattern has been shown in (Figure 6).
| Reference value | Acceptance value | Routine testing | ||||
|---|---|---|---|---|---|---|
| D1 | D2 | D1 | D2 | D1 | D2 | |
| Activity (MBq) | 914.74 | 919.19 | 976.22 | 973.7 | NA | NA |
| Sensitivity (cpm/µCi) | 156.6 | 159.1 | 150.6 | 152.6 | NA | NA |
| Sensitivity (CPS/MBq) | 70.5 | 71.6 | 67.8 | 68.7 | 74.2 | 74.5 |
Table 5: System sensitivity of head 1 & 2 with LEHR collimator, comparison of system sensitivity test with reference values.
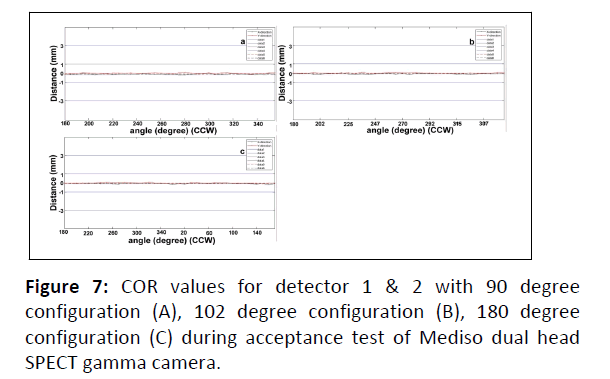
During acceptance and routine testing of COR, the values of COR for all detector configuration remained within the acceptable limits (Table 6, Figure 7) for all collimator.
| Center of rotation with LEHR collimator | Reference value (mm) | Acceptance test | Routine test | ||||
|---|---|---|---|---|---|---|---|
| Offset X (mm) | Max delta X (mm) | Max delta Y (mm) | Offset X (mm) | Max Delta X (mm) | Max Delta Y (mm) | ||
| 90 | ≤ 0.5 | -0.11 | 0.12 | 0.1 | -0.12 | 0.15 | 0.35 |
| 102 | ≤ 0.5 | -0.08 | 0.11 | 0.09 | -0.11 | 0.13 | 0.27 |
| 180 | ≤ 0.5 | -0.07 | 0.13 | 0.1 | -0.14 | 0.13 | 0.22 |
Table 6: Center of rotation values for detector 1 and detector 2.
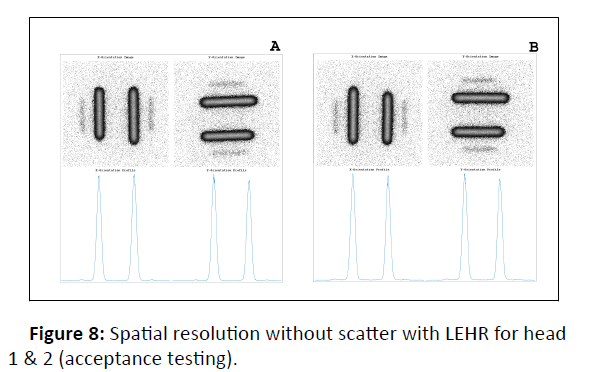
Typical values of spatial resolution without scatter is 7.2 mm in static mode with LEHR collimator. If the result of the test is below 9 mm it does not require sledge recalibration. However, the results were not accepted for our gamma camera. Because FWTM (X-axis) and FWTM (Y-axis) of acceptance test were observed above than the values recorded during factory tests. Similarly, routine test also provided the values of FWHM (X-axis), FWTM (X-axis) and FWTM (Y-axis) higher than factory tests (Table 7, Figure 8).
| Ref values (Factory test) | Acceptance testing | Routine testing | ||||
|---|---|---|---|---|---|---|
| Variable | Det-1 | Det-2 | Det-1 | Det-2 | Det-1 | Det-2 |
| FWHM (X-axis) | 7.1 | 7.2 | 7.3 | 7.1 | 8 | 8.2 |
| FWTM(X-axis) | 12.9 | 13 | 13.2 | 13.2 | 14.2 | 15.4 |
| FWHM (Y-axis) | 7.4 | 7.9 | 7.1 | 7.3 | 7.8 | 8.3 |
| FWTM(Y-axis) | 19 | 12.9 | 13.1 | 13.2 | 14.1 | 15.3 |
Table 7: Comparison of acceptance results with routine test for spatial resolution without scatter.
Typical values of wholebody resolution with LEHR collimator for dynamic maximum are 8.2 mm. If the result of the test is above 9 mm it refers to an incorrect sledge calibration. As the values obtained during acceptance testing were above than the results of the same test performed in factory settings. Therefore, the values were not accepted for our gamma camera (Table 8 and Figure 9).
| Acceptance values | Routine testing | ||||
|---|---|---|---|---|---|
| Variable | Specification of Det-1 | Det-1 | Det-2* | Det-1 | Det-2* |
| FWHM (X-axis) | - | 22.1 | 21.9 | 8 | 8.2 |
| FWTM (X-axis) | - | 39 | 39.4 | 14.2 | 15.4 |
| FWHM (Y-axis) | 9 | 23.6 | 24 | 7.8 | 8.3 |
| FWTM (Y-axis) | 14.2 | 40.3 | 42.1 | 14.1 | 15.3 |
Table 8: Comparison of system spatial resolution without scatter x with NEMA results. *NEMA values were not provided for Detector 2.
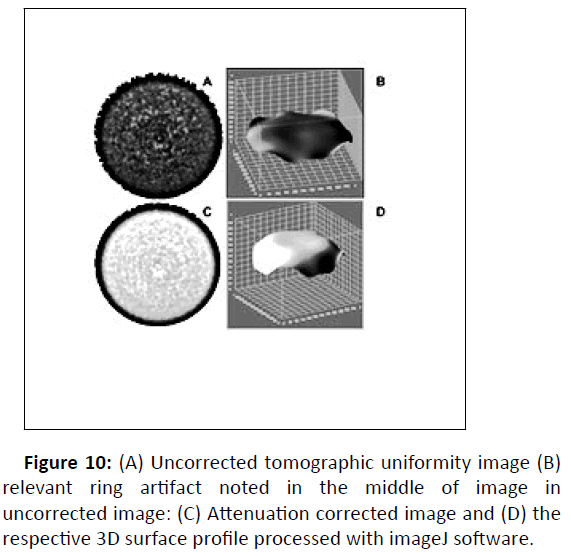
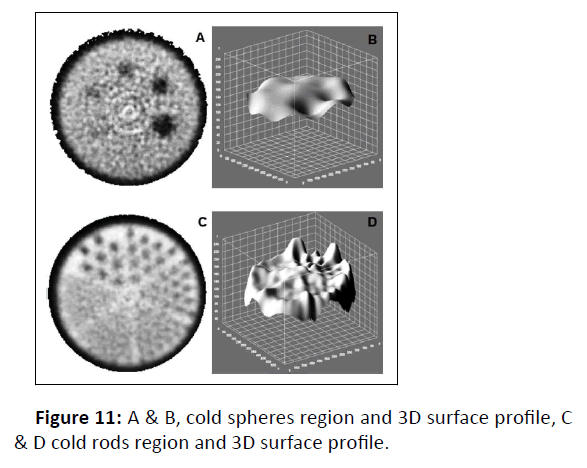
During Jaszczack phantom study, the uniformity and resolution images of the phantom were automatically processed with the help of Mediso processing workstation. The obtained images were further analyzed with imageJ software. A topographically uniform region (Figure 11A) shows a dimple in the middle of the same image processed with imageJ software (Figure 11B). This non-uniformity becomes further clear in Figure 10C and 10D. So, the homogeneity of SPECT image is compromised (Table 9, Figure 10).
| Homogeneous region | Cold Spheres region | Cold rods region | ||||
|---|---|---|---|---|---|---|
| Start | end | Start | end | Start | end | |
| Attenuation coefficient (1/cm) | 0.1 | 0.1 | 0.1 | 0.1 | 0.1 | 0.1 |
| Magnificaiton (%) | 105 | 105 | 105 | 105 | 105 | 105 |
| Averaged regions | 66 | 90 | 105 | 109 | 144 | 206 |
Table 9: Parameters for processing of Jaszczak phantom study.
Five cold spheres were visible in the pattern shown in (Figure 11 A-B). Similarly, four sections were spatial resolvable in Figure 11C-D.
Discussion
Auto tuning is the process which is performed before uniformity calibration and testing. In this procedure, PMTs gains are matched by slight adjustment of the high voltage of each PMT to obtain a uniform gain across all the PMT’s. All the Photomultipliers (PMT) must have matched amplification or gain to provide a uniform count density on image when the detector crystal is flooded with a uniform photons flux of radioactive source. If one of the PMT has a markedly lower gain or zero gain as compared to the surrounding, the area of the image corresponding to that location will appear as one of lower sensitivity or no sensitivity. Such conditions cannot be accepted in a newly installed gamma camera. A brief summary of all the tests and their outcome has been detailed in (Table 10).
| Sr. No. | Test | Results accepted | Comments | Reference |
|---|---|---|---|---|
| 1. | Record of radioactivity | Yes | - | Fig 1 |
| 2. | Energy Calibration and autotuning | Yes | - | Figure 2 |
| 3. | Intrinsic Flood Field Calibration with Tc & I-131 point source (detector 1 and 2) | No | Values are higher than reference values. | Table 1 |
| 4. | Extrinsic Flood Field Uniformity with Co-57 and Tc-99 m flood source (LEGP and LEHR collimators) | Yes | - | Table 2 |
| 5. | Intrinsic Spatial Resolution (detector 1 and 2) | Yes | OK, Distinct and clear bars are visible | Table 3, Figure 3 |
| 6. | Quadrant Bar Phantom Test for Detector 1 and 2 | Yes | OK, bars in three quadrants are visible | Figure 4 |
| 7. | Count rate performance test (detector 1 and 2) | Yes | OK | Table 4, Figure 5 |
| 8. | System Sensitivity with LEHR collimator (detector 1 and 2) | Yes | OK | Table 5, Figure 6 |
| 9. | COR at 90, 102 and 180-degree detector configuration with LEHR collimator (detector 1 and 2) | Yes | OK, the values are within reference limits | Table 6, Figure 7 |
| 10. | Spatial Resolution of Whole Body (detector 1 and 2) | No[1] | Values are higher than reference values. | Table 7, Figure 8 |
| 11. | Spatial Resolution without scatter with LEHR (detector 1 and 2) | Border-lined | Values of FWHM and FWTM along X-axis are slightly higher than reference. | Table 8, Figure 9 |
| 12. | Jaszczak Phantom test | Irregular | - | Table 9, Figure 10-11 |
Table 10: Test performed along-with their results and reference in the text.
The performance of CZT cameras is higher than that of Anger cameras. CZT cameras differ in that spatial resolution and contrast-to-noise ratio. They are better for Discovery NM 530c, whereas count sensitivity is markedly higher with the DSPECT. The above outcome has been found a ter the performance evaluation of Discovery NM 530c, DSPECT CZT cameras, and Symbia Anger camera with a phantom and human SPECT imaging. Their Physical performance was compared on reconstructed SPECT images from a phantom and from comparable groups of healthy subjects.
During another study, the practical performance of gamma camera was evaluated retrospectively from January 2005 to March 2013 under NEMA NU1-2001 protocols. The quality control data of Intrinsic lood ield Uniformity (IU), Intrinsic Energy Resolution (IER) and Peak Position (PP) were considered for the assessment. The mean value ± 3SD (99.73% con idence interval) of the average IU for Central Field Of View (CFOV) of Detector 1 and Detector 2 were 2.66 ± 1.27% and 2.54 ± 1.27% respectively, with a slightly increasing trend in each year. The detector resolution (IER) of head 1 & 2 was found at 9.23 ± 0.32% and 9.38 ± 0.25% respectively. The long-term resolution trends did not change even a ter the irst service of both detectors. The mean PP for Detector 1 and Detector 2 were recorded at 139.31 ± 0.76 and 139.30 ± 0.61 keV respectively. The percentage differences of the PP were negligible when compared to the year of installation [22].
In a study, performance tests of energy resolution, uniformity, spatial resolution and center of rotation, intrinsic uniformity values of dual head SPECT gamma cameras from Nucline spirit Mediso were evaluated. The energy peak was set at 140 KeV with 10.2% energy window. The average differential uniformity was noted at 1.9% which is well within the acceptable value of 3%. The integral uniformity was observed at 3.2% quite below the acceptable value of 4%. The values of average spatial resolution and center of rotation were 2mm and 0.5 mm respectively [23]. Quality control of Siemens Symbia S Series SPECT gamma camera uses a point source 99mTc for intrinsic uniformity calibration. In a study, the integral uniformity for the central field of view (CFOV) ranged 2.88- 4.01% and the same for the Useful Field Of View (UFOV) ranged 4.30%-4.77%. The differential uniformity for the CFOV was found from 1.53% to 2.04% and for the UFOV it was from 2.32% to 2.77% [24].
For a given size and sampling, crystals of different materials will have different spatial resolutions. This is because γ rays do not interact at the surface of a crystal but penetrate the crystal before interacting. Spatial resolution is also affected by the energy of the photon and, for scintillation detectors, the efficiency of collection of the scintillation light by the PMTs.
The spatial resolution can also depend on the count rate or amount of activity in the scanner. As the count rate increases, there is an increased chance that two events will be detected at the same time in nearby locations in the detector. These events will pile up and appear as a single event at an intermediate location with a summed energy. This can lead to a loss of resolution with increasing activity[21].
Poor planar image spatial resolution appears when the distance between patient and collimator is large or linear correction of the detector is poor. The subjective analysis of linearity test should be avoided. Instead software can be used for linearity assessment. In Mediso acceptance testing a software based assessment is performed [21].
The impact of collimator blurring, linear and angular sampling, reconstruction algorithm, spatial smoothing, and impact of electronics is included in extrinsic resolution, reflecting the resolution of the complete imaging system. The spatial resolution achieved in patient images is typically somewhat worse than the extrinsic spatial resolution[21].
The qualitative assessment of ring artifacts indicates that extrinsic uniformity correction significantly improves the image quality over intrinsic uniformity correction by taking into account non-uniformities arising from the collimator. The evaluation of Count Rate Performance (CRP) and system deadtime (τ) are utilized for image correction in quantitative studies. In a paper, CRP of three modern gamma cameras and τ were estimated using two methods (decay and dual source). The estimates of τ determined from the paralyzable portion of the CRP curve using the rates method and the counts method were found to be highly correlated (r=0.999) but with a small (~6%) difference. No statistically significant difference was observed between the estimates of τ using the decay or dual source methods under identical experimental conditions (p=0.13) [25].
In contrast to the conventional method in which a Co-57 sheet source is fastened to the collimator, point-source method acquires the images intrinsically using a Tc-99 m point source placed near the ISO-center of gantry rotation in order to perform rotational uniformity and sensitivity according to AAPM report 52.
As with the conventional method, the point-source method acquires 5K count flood images at four distinct gantry positions to calculate the maximum sensitivity variation MSV—a quantitative metric of rotational uniformity and sensitivity variation. The point-source method incorporates corrections for the decay of Tc-99 m between acquisitions, the curvature in the image intensity due to variation in photon flux across the detector from a near-field source, and the source-to-detector distance variations between views. The MSV calculated using the conventional and point-source methods exhibited a high degree of correlation and consistency with equivalence. The precision of the point-source method 0.145% is lower than the conventional method 0.04% but sufficient to test MSV [26].
Performance measurements and quality assurance of gamma camera and SPECT have been quite variable even though they are performed with standard protocols [27]. In a study by Nelson et al., pixel value-based evaluation was compared with a new uniformity analysis metric which can identify structures and patterns of flood field uniformity image. The metric was named as Structured Noise Index (SNI) based on two-dimensional Noise Power Spectrum (NPS). The SNI outperformed the pixel valuebased metrics in terms of its correlation with the visual score. The SNI had 100% sensitivity for identifying both structured and non-structured non-uniformities for the integral UFOV and CFOV metrics [28]. In another study by Pandy et al., a computer-based software tool was developed to verify uniformity indices of gamma camera. The indices measured with the software tool showed excellent correlation with vendor's software based on Bland-Altman analysis. All measurements were within the ± 2 Standard Deviation (SD) range [29]. Similarly, statistical models were applied to assess, quantify, and provide positional information of variations between planar images acquired at different times but under similar conditions by Kalemis et al. [30,31].
At acceptance testing, the measured uniformity values are within ± 25% and a value of integral or differential uniformity that is 10% or more [20]. above the manufacturer's worst-case value would require corrective action through service engineer [32,33]. The uniformity values need to be repeated before the start of patient studies. For routine uniformity testing procedures, certain action levels can be established at the time of acceptance testing. The clinical procedures including planar only, whole body or quantitative SPECT determine the stringency of the action levels. If these actions levels exceed the routine testing, follow-up action should be initiated. The first step may always be to reacquire correction field flood data. Correction floods or calibration with Tc-99 m and I-131 were repeated, still the values of uniformity test went above the set limits of manufacturer.
In a study, NMQC software from IAEA was used to perform image analysis of ten non-uniform QC images from a gamma camera. Excel analysis was used as the baseline calculation for the non-uniformity test. A good agreement was noted between the software and excel calculations as a result of non-uniformity analysis. The average differences were 0.3%, 2.9%, 1.3% and 1.6% for integral UFOV, differential UFOV, integral CFOV and differential CFOV respectively. In the same study, company’s own QC software produced average differences of 14.6%, 20.7%, 25.7% and 31.9% for the same parameters respectively when compared with excel analysis. These significant differences were observed due to different pixel sizes used in analysis [20].
The sensitivity of NaI crystal varies from one detector to another. The detector technology of SPECT and SPECT/CT systems is continuously advancing leading to novel system designs for organ-specific or adaptive applications, although ultimate performance continues to be largely limited by physical collimation [34].
Quality assurance with phantom can be assessed with textural analysis. In a study, while monitoring of gamma-camera uniformity, two statistics-based tests were used to assess, quantify, and provide positional information and variations between planar images acquired at different times but under similar conditions. In addition to gamma camera quality control, they could be applied to any pair (or a set) of registered planar images to detect subtle changes, e.g. a set of scintigrams or conventional radiographs of a patient before, during and after treatment [35].
Different gamma detection materials affect uniformity image. The installed gamma camera is based on Sodium iodide crystal detector. Recently, scintillators are being investigated because of their great image quality, high light yield and energy resolutions. They are not hygroscopic in nature. However, these scintillators should exhibit characteristics of position linearity, intrinsic spatial resolution, integral uniformity, image contrast and signal to noise ratio in order to be used for SPECT applications. Even though an array-type scintillation crystal has disadvantages, such as lower sensitivity, lower energy resolution and higher cost than a plate-type scintillation crystal caused by the gaps between the crystal elements and small pixel size [36].
Conventional gamma cameras exhibit substantial dead-time and mis-registration of photon energies up to 100 ms after intense x-ray pulses. These are due to PMT limitations and due to afterglow in the crystal. Using PMTs with modified circuitry, we show that deteriorative afterglow effects can be reduced without noticeable effects on the PMT performance, up to x-ray pulse doses of 1 nGy [37].
Being an under-construction hospital, At the start of gamma camera installation, the cleaning of dust at the installation site and maintenance of temperature were challenges. The dust was cleaned and ambient conditions were improved before installation, except the unstable voltage to the unit. An Uninterrupted Power Supply (UPS) was installed to maintain a stable power connection to the gamma camera. The variation may have an impact on the electronics of gamma camera and HVAC system [38,39]. At the end of installation, gamma camera was kept in standby mode and temperature was maintained at 22 Centigrade.
Conclusion
All the quality assurance procedures can be performed on gamma camera system with acquisition and processing tools provided by the manufacturer. However, certain acceptance tests did not pass. These acceptance tests performed on Mediso Nucline dual head SPECT gamma camera included energy calibration, uniformity calibration and test with Tc and I-131, extrinsic uniformity with Co-57 m and Tc-99 m using LEGP, LEHR collimators, intrinsic spatial linearity of detector 1 and 2, quadrant bar phantom study, count rate performance test, system sensitivity, COR at 90°, 102° and 180° detector configuration, spatial resolution of whole body, spatial resolution without scatter with LEHR, intrinsic energy resolution and Jaszczak study. The electrical power and temperature conditions were maintained for the period between acceptance testing and routine testing of the machine before actually starting patients.
Acknowledgement
The authors of the paper have no conflict of interest.
Funding
We acknowledge the support of M/S Radiant Medical (Pvt) Ltd. Pakistan during acceptance testing of the equipment and resulting publications.
References
- Gutfilen B, Valentini G (2014) Radiopharmaceuticals in nuclear medicine: Recent developments for spect and pet studies. Biomed Res Int 32: 426892-3.
[Crossref],[Google Scholar],[Indexed]
- Yang F, Yang K, Yang C (2018) Development and application of gamma camera in the field of nuclear medicine. Int J Sci 7: 21-24.
- Wheat JM (2011) An introduction to nuclear medicine. Australian Institute of Radiography 58(3): 38-45
[Crossref]
- Bolstad R, Brown J, Grantham V (2011) Extrinsic versus intrinsic uniformity correction for γ-Cameras. J Nucl Med Technol 39(3): 208-212.
[Crossref],[Google Scholar],[Indexed]
- Polito C, Pani R, Frantellizzi V, De-Vincentis G, Pellegrinie R (2018) Imaging performances of a small FoV gamma camera based on CRY018 scintillation crystal. Nuclear Instruments and Methods In Physics Research Section A: Accelerators, Spectrometers, Detectors and Associated Equipment. 912:33-35.
- Imbert L, Poussier S, Franken PR, Songy B, Verger A (2012) Compared performance of high-sensitivity cameras dedicated to myocardial perfusion SPECT: A comprehensive analysis of phantom and human images. J Nucl Med 53(12): 1897-1903.
[Crossref],[Google Scholar],[Indexed]
- Soni PS (1992) Quality control of imaging devices. International Atomic Energy Agency (IAEA): 49-87
- Moreno AM, Laguna RA, Trujillo ZFE (2012) Implementation of test for quality assurance in nuclear medicine gamma camera. United States.
- White S (2010) TUâ?ÃÂBâ?ÃÂ201Câ?ÃÂ01: Gamma camera and SPECT routine quality assurance testing. Med Phys 37(6): 3377-3377.
- Internation Atomic Energy Agency (2009) Quality assurance for SPECT systems, human health series No. 6. IAEA, Vienna Internation Atomic Energy Agency.
- Radiopharmaceuticals in nuclear medicine: Recent developments for spect and pet studies.
- Murphy PH (1987) Acceptance testing and quality control of gamma cameras, including SPECT. J Nucl Med 28(7): 1221-1227.
- AbuAlRoos NJ (2020) Review on routine quality control procedures in nuclear medicine instrumentation. J Eng Sci Technol: 1-5.
- Aida A, Prajitno P, Soejoko DS (2019) Comparison of SPECT quick QC between using in-house hot phantom and Jaszczak phantom: A preliminary study. J Phys Conf Ser 1248(1): p012034.
- Vaiano A (2019) Standard operating procedures for quality control of gamma cameras. cham: Springer International Publishing 1051-1059.
- Sokole BE, PÅ?achcínska A, Britten A (2010). Acceptance testing for nuclear medicine instrumentation. Eur J Nucl Med Mol Imaging 37(3): 672-681.
[Crossref],[Google Scholar],[Indexed]
- Macey DJ (1972) The uniformity of gamma cameras. Phys Med Biol 17(6): 857-858.
- Elkamhawy AA, Rothenbach JR, Damaraju,S, Badruddin SM (2000) Intrinsic uniformity and relative sensitivity quality control tests for single-head Gamma cameras. J Nucl Med Techno 28(4): 252-256.
- Abdullah MNA (2013) Intrinsic uniformity test for a dual head SPECT gamma camera. Bangladesh Journal of Physics13: p19.
- Edam N, Fornasier MR, Denaro MD, Sulieman A, Alkhorayef M, et al. (2018) Quality control in dual head gamma-cameras: Comparison between methods and software used for image analysis. Appl Radiat Isot 141: 288-291.
[Crossref],[Google Scholar],[Indexed]
- Vienna: International Atomic energy Agency (2015) Nuclear medicine physics.
- Nopparat P (2013) Studies of quality control data under NEMA NU1-2001 to evaluate the performance of gamma camera. J Assoc Med Sci 46(3): 215-215.
- Mohamed SAS (2018) Evaluation the quality control program of SPECT cameras in nuclear medicine departments in Sudan.
- Hasan MR, Rashid-Khan MH, Rahman MR, Parvez MS, Islam MR, et al. (2017) Quality control of gamma camera with SPECT systems. International Journal of Medical Physics, Clinical Engineering And Radiation Oncology 6(3): 225-232.
- Silosky M, Johnson V, Beasley C, Kappadath SC (2013) Characterization of the count rate performance of modern gamma cameras. Med phys 40(3): p032502.
[Crossref],[Google Scholar],[Indexed]
- Kappadath SC, Erwin WD, Wendt RE (2009) A novel method to evaluate gamma camera rotational uniformity and sensitivity variation: Novel method to evaluate gamma-camera rotational sensitivity variation. Med phys 36: 1947-1955.
[Crossref],[Google Scholar],[Indexed]
- Halama J, MO-AB-206-02 (2016) Testing gamma cameras based on TG177 WG report.43: 3693-3693.
- Nelson JS, Christianson OI, Harkness BA, Madsen MT, Mah E, et al. (2014) Improved nuclear medicine uniformity assessment with noise texture analysis. J Nucl Med 55(1): 169-174.
[Crossref],[Google Scholar],[Indexed]
- Pandey AK, Sharma PD, Kumar JP, Saroha K, Patel C, et al. (2017) Calculating gamma camera uniformity parameters: Beyond the vendor-specific protocol. Indian J Nucl Med. 32(4): 279-282.
[Crossref],[Google Scholar],[Indexed]
- Kalemis A, Bailey DL, Flower MA, Lord SK, Ott1 RJ, et al.(2004) Statistical pixelwise inference models for planar data analysis: an application to gamma-camera uniformity monitoring. Phys Med Biol 49(14): 3047-3066.
- Domingo-Pardo C, Goel N, Engert T, Gerl J, Isaka M, et al. (2009) A Position sensitive\gamma ray scintillator detector with enhanced spatial resolution, Linearity, and field of view. IEEE Transactions on Medical Imaging 28(12): 2007-2014.
[Crossref],[Google Scholar],[Indexed]
- Quality control of nuclear medicine instruments (1991) Vienna: International Atomic Energy Agency (IAEA).
- Quality assurance for SPECT systems (2009) Vienna: International Atomic Energy Agency (IAEA).
- Hutton BF (2014) The origins of SPECT and SPECT/CT. Eur J Nucl Med Mol Imaging 41: 3-16.
[Crossref],[Google Scholar],[Indexed]
- Kalemis A, Bailey DL, Flower MA, Lord SK, Ott1 RJ (2004) Statistical pixelwise inference models for planar data analysis: An application to gamma-camera uniformity monitoring. Phys Med Biol 49(14): 3047-3066.
[Crossref],[Google Scholar],[Indexed]
- Jeong, MH, Choi Y, Chung HY, SongTY, Jung JH, et al. (2004) Performance improvement of small gamma camera using NaI(Tl) plate and position sensitive photo-multiplier tubes. Phys Med Biol 49(21): 4961-4970.
[Crossref],[Google Scholar],[Indexed]
- Koppert WJC, Velden SVD, Steenbergen JHL, De-Jong HWAM (2018) Impact of intense x-ray pulses on a NaI(Tl)-based gamma camera. Phys Med Biol 63(6): 065006-065006.
[Crossref],[Google Scholar],[Indexed]
- Kim S, McClish M, Alhassen F, Seo Y, Shah KS, et al. (2011) Temperature dependent operation of PSAPD-based compact gamma camera for SPECT imaging. IEEE Trans Nucl Sci 58(5): 2169-2174.
[Crossref],[Google Scholar],[Indexed]
- Lacombe K, Amoros C, Belkacem I, Dezalay JP, Houret B, et al. (2018) Temperature effect on detectors performance of the SVOM ECLAIRs X/Gamma camera., IEEE 1-4.
Open Access Journals
- Aquaculture & Veterinary Science
- Chemistry & Chemical Sciences
- Clinical Sciences
- Engineering
- General Science
- Genetics & Molecular Biology
- Health Care & Nursing
- Immunology & Microbiology
- Materials Science
- Mathematics & Physics
- Medical Sciences
- Neurology & Psychiatry
- Oncology & Cancer Science
- Pharmaceutical Sciences
