An Investigation on the Dependence of EBT-3 Gafchromic Film on Energy, Dose, and Post-Exposure Scanning Time
Jibon Sharma*and Banashree Kalita
Department of Radiation Oncology, State Cancer Institute, Assam, India
Published Date: 2024-08-21DOI10.36648/2574-285x.9.2.72
Jibon Sharma* and Banashree Kalita
Department of Radiation Oncology, State Cancer Institute, Assam, India
- *Corresponding Author:
- Jibon Sharma
Department of Radiation Oncology, State Cancer Institute, Assam,
India,
E-mail: sharma5jibon@gmail.com
Received date: July 25, 2024, Manuscript No. IPIMP-24-19438; Editor assigned date: July 29, 2024, PreQC No. IPIMP-24-19438 (PQ); Reviewed date: August 07, 2024, QC No. IPIMP-24-19438; Revised date: August 12, 2024, Manuscript No. IPIMP-24-19438 (R); Published date: August 21, 2024, DOI: 10.36648/2574-285x.9.2.72
Citation: Sharma J, Kalita B (2024) An Investigation on the Dependence of EBT-3 Gafchromic Film on Energy, Dose, and Post-Exposure Scanning Time. J Med Phys Appl Sci Vol.9 No.2:72.
Abstract
Background: The Gafchromic EBT-3 film is widely used in radiation oncology to measure dose distribution and absolute doses for various energies. EBT-3 films are exposed to radiation over a wide energy range and doses to provide a complete picture of energy and dose dependency. Additionally, we also examined the evolution of optical density as a function of time after irradiation.
Materials and methods: The study used 60Co gamma (1.17-1.33) MeV and megavoltage X-rays (6,10 and 15 MV) to measure the film’s response to energy. The Gafchromic EBT-3 film’s response to each of the above energies was meas ured over the dose range of (0.1-10 Gy). The optical densities of irradiated films were read 24,48 and 72 h after irradiation to evaluate the fluctuation of optical density with post-exposure scanning time. The study used an Epson Expression12000 XL flatbed scanner and Image-J software to assess the optical densities. Each film strip was placed on the scanner bed with care in the same orientation at the same location.
Results: When compared to 60Co, the optical density of the EBT-3 film was noticeably different for the three energies 6, 10 and 15 MV. For 15 MV higher differences are seen at lower doses and gradually decrease with the increase of doses, with 18.2% at 10 cG y and 6.5% at 1000 cGy. For the dose above 100 cGy, no statistical difference was observed between 6 and 15 MV beams. We observed no significant changes of optical density due to various post-irradiation times. But compared to higher doses very minor changes are noticed in lower doses, which is not statistically significant.
Conclusion: According to the findings of our study indicate that Gafchromic EBT-3 film is a reliable dosimeter with insignificant energy-independent responses across a wide range of beam energies and modalities used in radiation oncology.
Keywords
Gafchromic films; Dose-response curve; Energy dependence; Post-exposure scanning time
Introduction
Gafchromic EBT film has been used for assessing dose distributions and absolute doses over a wide range of x-ray and electron beam energies routinely used in diagnostic imaging and radiation oncology since its inception in 2004 [1-4]. This film has an effective atomic number of Zeff=7.26, which is near water (Zeff=7.42). Its constituents are C (51.1%), O (32.8%), H (8.8%), Al (6.7%) and Li (0.6%) [5]. It also has the properties of low energy dependence [6], and high spatial resolution [7]. These characteristics made EBT film superior to other conventional two-dimensional radiation detectors. Every system has its limitations, so to establish the best gafchromic film dosimetry system, a suitable protocol should be developed for each film type/scanner combination [8]. Previous studies have reported on the temperature dependence of the Gafchromic EBT-3 films [9,10] .Therefore we stored the film below 22˚C, before and after the calibration. The EBT-3 film, which has the same active layer composition as the EBT-2 film was released in late 2011 [11]. It is made up of an active layer (28 μm thick) sandwiched between two layers of polyester substrate (125 μm thick). The structure of the film is shown in Figure 1.

Figure 1: Structure of Gafchromic EBT-3 film.
The presence of components like the diacetylene monomer, a marker dye, and a stabilizing agent in the active layer makes the film perfectly suitable for radiation dose measurement. After being exposed to ionizing radiation or thermal annealing the active component undergoes a 1,4-polymerization process, which changes optical density depending on the specific compositions of the active layer [12,13]. As more dose is absorbed by the active layer, the diacetylene molecules in the chain polymerization extend over time as a result of the film growing darker [14]. The small silica particles are applied to the polyester substrate’s surface to reduce the Newton’s Rings artifacts. Comparing the EBT-3 film to the EBT and EBT-2 films, the EBT-3 has a better structure and performance [15-17].
Film measurements may be affected by artifacts and material in homogeneities. Slight variation in active layer thickness may lead variation to the film signal and hence to the measured dose. The well-established triple channel analysis method reduced these artifacts in EBT film. Micke et al. and Mayer et al., employed different ways to this multichannel method resulting in equal dose distribution [18,19].
Many research groups have investigated the energy dependence of the EBT-3 film response caused by different radiation beam quality. The response of the EBT-3 films to three X-ray beams with energies ranging from 50 kV to 15 MV has been studied by Massillon et al. The high energy photon beams (e.g., 6 and15 MV) frequently used in radiotherapy was found to have a weakly dependent relationship with the film response [20]. However, for low energy (e.g., 50 kV) X-rays variations of more than 11% were observed because of energy dependence. An earlier generation of EBT-3 films and monochromatic beams were used by Brown et al., to investigate the energy dependence. Over the range of 25 keV to 4 MV they found a weak energy dependence [21]. Hammer et al., have examined the dosimetric intrinsic energy response of Gafchromic film on 15 beam qualities within the (500-7002 mGy) range and suggested energy correction factors [22]. There have been many studies that have evaluated the doses response curves of EBT-3 type film [23,24].
The aim of this work is to investigate the EBT-3 Gafchromic film response with triple channel analysis method over a wide energy range (1.25 to 15 Mev) and doses (10-1000cGy) in order to provide a complete picture of energy and dose dependency. The practical advantage of choosing a range of energy independence for Gafchromic films is that they can be calibrated in a simple geometry and used for dose measurements without the need of energy correction factors. By delivering a range of known doses and calculating the associated Optical Density (OD) for each dose based on measurements of the initial and transmitted light intensity through the film. It is possible to determine the dose response of a film for a specific radiation source. From the relationship, relative dose measurements can be carried out within the measured dose range.
The polymerization process in Gafchromic film continues for considerable time after irradiation. The consequence of the continued polymerization is that OD grows over time. In our studies, the films are left for preferably 24 h before scanning as suggested by many authors. In order to check the variation of optical density with post irradiation time, scans were performed after 24,48 and 72 h.
Materials and Methods
Film pieces were cut in the size of 5 X 5 cm2, which are taken from the same film pack. A total 65 films pieces were used in these studies. Two film holders of sizes 29.5 X 21.5 cm2 are used to keep the films for scanning. The picture of film holders is shown in Figure 2. One holder can hold total 15 numbers of film fragments for scanning, which saves the time and make scanning more efficient and comfortable. During scanning one holder was loaded with exposed film while another is being scanned in the scanner.

Figure 2: Film holder with loaded films.
A single sheet with a tiny notation marking the original orientation on each piece. To provide the OD's backdrop, one fragment of the film was left unirradiated. The film fragments received escalating doses of radiation. The holder along with all 15 numbers of irradiated films are digitized with the scanner and saved in TIFF format to ensure the maximum possible reproduction quality of the original image.
At least 24 h following irradiation, all exposed films were digitalized using an Epson Expression 12000 XL scanner at a spatial resolution of 300 dpi. Utilizing film Image-J software, the pictures were analyzed after splitting the single image sheet into triple channel images (red, green, and blue). A square ROI (Region of Interest) of 2 cm × 2 cm was used to quantify the optical density and the standard deviation, and optical density was quantified by using the film Image-J software (versionv1.54e.).
According to the EBT-3 user specification guide, the dynamical dose range of the Gafchromic films ranges from 10 cGy to 2000 cGy. However prior research has shown that the films can accurately estimate doses up to about 40Gy using a multichannel method. This method does however depend on the precision of calibration and is therefore covered by the investigation in this work [23].
EBT-3 films were exposed to doses ranging from 10 cGy to 1000 cGy utilizing beam energies of 1.25 MeV gamma ray, 6 MV, 10 MV, and 15 MV x-rays to test for energy and dose dependency. The energy and dose range we selected mostly used in external radiotherapy procedures. The results for energy dependency that were given in the quotes were an average of the results at various dosage levels. Using a varian true beam linear accelerator and panacea teletherapy unit, irradiations were carried out on a solid water phantom of 30 cm3 [25]. Each film peace was placed at a depth of dose maximum for all energies in the phantom, which consisted 30 cm × 30 cm slabs of different thickness. According to the IAEA (International Atomic Energy Agency) TRS-398 procedure for megavoltage x-rays, the absorbed dose calibrations were carried out using a Farmer thimble-type ionization chamber. The dosages were measured in water, and no correction were made for the effect of solid water or EBT-3 film material on dose absorption.
In order to define the minimal usable dose limit for this film dosimetry system, uncertainty analysis in the dose determination was also carried out.
The films were scanned and processed for the determination of net OD using the Devic et al., method [26] . The amount of film darkening was measured using the net Optical Density (net OD), which was computed from the pixel values. The net OD was defined as the difference between the optical densities of the exposed (ODexp) and unexposed (ODunexp) film.
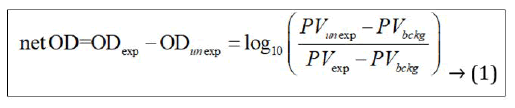
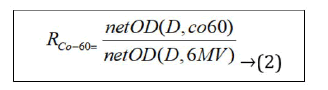
According to this definition, PVunexp, PVexp and PV bckg are the measured pixel values of black opaque cardboard, unexposed film, and exposed film respectively. To minimize uncertainties associated with post irradiation coloration both the calibration film and experimental film should be scanned after approximately the same time interval following irradiation. To check the energy dependence of the film the quantity Rx, which defines the energy dependence metric of interest is quantified. It is defined as the ratio of net Optical Density (net OD) at a beam of energy x to the need for the same dose at 6 MV, i.e.,
The systematic error introduced by the Inverse Square Law (ISL) factor used to compute the output of the film location with chamber position is the second source of uncertainty. This uncertainty can be ignored in this study as it is <0.01%. Using a PTW chamber, the ISL was measured with a 0.6% positional uncertainty. The final two sources of uncertainties are the ion recombination factor (0.1%) and the pressure and temperature correction factor (0.3%). The film was irradiated immediately following the calibration of the device and the output reproducibility was checked to be <0.1%. The uncertainty in the OD was derived by irradiating the film five times at 100 cGy, 6 MV, and calculating the standard deviation of average. The uncertainty from the film noise is 1.3%. The total dose uncertainty uDw is calculated by using the error propagation theory.
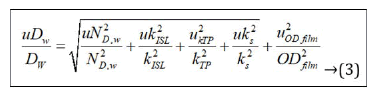
Where, NDW-calibration factor, uNDW-the related calibration uncertainty, kISL-Inverse Square Law (ISL) factor, ukISL-related uncertainty for ISL, kTP-temperature and pressure calibration factor, ukTP-related uncertainty of kTP, kS-ion recombination correction factor, ukS-related uncertainty of kS, ODFilm-Optical Density of the film and uODFilm-related uncertainty of OD of the film.
Results and Discussion
The dose-response calibration curves consisting of various energies (Co-60, 6 MV, 10 MV, and 15 MV) and multiple dose points were generated as shown in Figure 3 for 3 (three) colour channels (red, green, and blue). These curves show the film response (net optical density, net OD) as a function of the dosage applied to the film. It was found that the response curves of the radio chromic films scanned in the red and green channels are above the response curve of the films scanned in the blue channel. These results are consistent with those obtained for the EBT radio chromic film [27,28].

Figure 3: Dose response curve of all energies with triple colour analysis.
The estimation of the calibration constant (a, b and c) is performed for each colour channel with a non-linear polynomial fit by using origin-2023 version software. The resulting calibration dependence was approximated by the following function after polynomial fit.
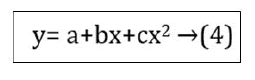
where y=Dose in cGy, x=Net Optical Density, a, b and c are the fit free parameter.
The fitting parameter coefficient of determination i.e., R2 of all energies with three colours are shown in Table 1. From the analysis it was found that the blue colour channel responds better and accurate results for dosimetric evaluation although it has the lowest response compare to the other two channels. The findings are consistent with other studies [29,30]. The resulting calibration was approximated by linear fit regression curve of 6 MV blue colour channel and the results with fitting parameters are shown in Figure 4 and the equation and intercept of dose response curve has been given in Table 2. The calibration curve of this blue channel has the flattest path, which would indicate less contrast in the dose distribution when using this colour channel to evaluate the dose measurements.
| Parameter | Value | R2 | Value | R2 |
|---|---|---|---|---|
| Co-60 (Red) | 6 MV (Red) | |||
| Intercept (a) | 0.080 ± 0.01 | 0.95 | 0.046 ± 0.02 | 0.97 |
| b | 0.001 ± 1.11 × 10⁻⁴ | 0.001 ± 8.97 × 10⁻⁵ | ||
| c | -7.46 × 10⁻⁷ ± 1.16 × 10⁻⁷ | -7.24 × 10⁻⁷ ± 9.36 × 10⁻⁸ | ||
| Co-60 (Green) | 6MV (Green) | |||
| Intercept (a) | 0.051 ± 0.01 | 0.984 | 0.029 ± 0.01 | 0.987 |
| b | 0.001 ± 7.76 × 10⁻⁵ | 0.001 ± 6.76 × 10⁻⁵ | ||
| c | -7.95 × 10⁻⁷ ± 8.09 × 10⁻⁸ | -7.76 × 10⁻⁷ ± 7.04 × 10⁻⁸ | ||
| Co-60 (Blue) | 6 MV (Blue) | |||
| Intercept (a) | 0.033 ± 0.006 | 0.98 | -0.002 ± 0.004 | 0.98 |
| b | 3.17 × 10⁻⁴ ± 3.77 × 10⁻⁵ | 3.05 × 10⁻⁴ ± 2.68 × 10⁻⁵ | ||
| c | -1.48 × 10⁻⁷ ± 3.93 × 10⁻⁸ | -1.22 × 10⁻⁷ ± 2.80 × 10⁻⁸ | ||
| 10 MV (Red) | 15 MV (Red) | |||
| Intercept (a) | 0.064 ± 0.01 | 0.954 | 0.062 ± 0.01 | 0.96 |
| b | 0.001 ± 1.02 × 10⁻⁴ | 0.001 ± 1.04 × 10⁻⁴ | ||
| c | -7.01 × 10⁻⁷ ± 1.06 × 10⁻⁷ | -7.35 × 10⁻⁷ ± 1.08 × 10⁻⁷ | ||
| 10 MV (Green) | 15 MV (Green) | |||
| Intercept (a) | 0.038 ± 0.01 | 0.99 | 0.033 ± 0.010 | 0.99 |
| b | 0.001 ± 6.86 × 10⁻⁵ | 0.001 ± 6.19×10⁻⁵ | ||
| c | -8.19 × 10⁻⁷ ± 7.15 × 10⁻⁸ | -8.11 × 10⁻⁷ ± 6.45 × 10⁻⁸ | ||
| 10 MV (Blue) | 15 MV (Blue) | |||
| Intercept (a) | 0.003 ± 0.002 | 0.992 | 0.004 ± 0.002 | 0.994 |
| b | 3.43×10⁻⁴ ± 1.71 × 10⁻⁵ | 2.87 × 10⁻⁴ ± 1.42 × 10⁻⁵ | ||
| c | -1.50 × 10⁻⁷ ± 9.36 × 10⁻⁸ | -9.35 × 10⁻⁸ ± 1.48 × 10⁻⁸ | ||
Table 1: Calibration fitting parameters acquired for all four energies.
| Equation | y=a+b*x |
| Intercept | 0.0081 ± 0.00384 |
| Slope | 2.08922E-4 ± 8.478 |
| Pearson's r | 0.98946 |
| Adj. R-Squ | 0.97742 |
Table 2: Equation and intercept of dose-response curve.

Figure 4: Representat on of dose-response curve for 6
MV beam. The solid line represents normal fitting line
and dashed line represent 95% confidence limit. Note: (  ):
OD; (
):
OD; ( ): Fited Y of OD; (
 ): 95% of Confidence Band of OD.
The relative response ‘R’ is calculated by using “Equation (2)” to determine the fluctuation for a given absorbed dose value, D by dividing the net OD/dose obtained at any energy beam by the measurement for the 6 MV photon. To confirm the energy dependence, it was found from Figure 5 that there is no variation in the optical density of EBT-3 film for the two energies 10 MV and 15 MV, as compared to 6 MV energy. With 8.2% at 10 cGy and 1.01% at 1000 cGy Co-60 exhibits higher difference at lower doses and gradually decreases as doses are increased.

Figure 5: The relative net optical density for various doses
for Co-60,10 MV and 15 MV with respect to 6 MV energy. Note: ( ): RCo-60; (
 ): R10 MV; (
 ): R15 MV.
When compared with Co-60, the optical density of the EBT-3 films is noticeably different for the three energies 6,10 and 15 MV. For 15 MV higher differences are seen at lower doses and gradually decrease with the increase of doses, with 18.2% at 10 cGy and 6.5% at 1000 cGy. The variation of optical density with post-irradiation time, scans were performed after 24,48 and 72 h and the results are depicted in Figure 6.

Figure 6: Variation of OD with post-irradiation time. Note: (  ): 10 cGy; (
 ): 100 cGy; (
  ): 200 cGy;
(
): 200 cGy;
(  ): 500 cGy; (
  ): 800 cGy; (
  ): 1000 cGy.
It was observed that no significant changes of optical density due to various post-irradiation times of 24,48 and 72 h. But compared to higher doses very minor changes are noticed in lower doses, which is not statistically significant. To check the statistical difference one-way ANOVA parametric analysis was performed. Following this result, the post-exposure stabilization of our protocol for EBT-3 film.
Conclusion
The findings of our study indicate that Gafchromic EBT-3film is a reliable and suitable dosimeter for two-dimensional dosimetric application with insignificant energy-independent responses across a wide range of beam energies and modalities used in Radiation Oncology. It is recommended to use the 6 MV calibration graph as standard to calculate the unknown dose for other energies i.e.,10 and 15 MV used in radiotherapy. The study emphasizes the need for triple channel analysis to eliminate the artifacts caused by film inhomogeneity. No significant variations of optical densities are noticed due to changes in post-irradiation time of 24, 48 and 72 h.
References
- Arjomandy B, Tailor R, Anand A, Sahoo N, Gillin M, et al. (2010) Energy dependence and dose response of Gafchromic EBT2 film over a wide range of photon, electron, and proton beam energies. Med Phys 37: 1942-1947.
[Crossref] [Google scholar] [Indexed]
- Fletcher CL, Mills JA (2008) An assessment of GafChromic film for measuring 50 kV and 100 kV percentage depth dose curves. Phys Med Biol 53: 209-218.
[Crossref] [Google scholar] [Indexed]
- Oldham M, Sakhalkar H, Guo P, Adamovics J (2008) An investigation of the accuracy of an IMRT dose distribution using two and three-dimensional dosimetry techniques. Med Phys 35: 2072-2080.
[Crossref] [Google scholar] [Indexed]
- Fiandra C, Ragona R, Ricardi U, Anglesio S, Giglioli FR (2008) Absolute and relative dose measurements with GafchromicTM EBT film for high energy electron beams with different doses per pulse. Med Phys 35: 5463-5470.
[Crossref] [Google scholar] [Indexed]
- Bassi S, Cummins D, McCavana P (2020) Energy and dose dependence of GafChromic EBT-3-V3 film across a wide energy range. Rep Pract Oncol Radiothe. 25: 60-63.
[Crossref] [Google scholar] [Indexed]
- Butson MJ, Cheung T, Yu PKN (2006) Weak energy dependence of EBT gafchromic film dose response in the 50 kVp-10 MVp X-ray range. Appl Radiat Isot 64:60-62.
[Crossref] [Google scholar] [Indexed]
- Martisikova M, Ackermann B, Jakel O (2008) Analysis of uncertainties in Gafchromic® EBT film dosimetry of photon beams. Phys Med Biol 53: 7013-7027.
[Crossref] [Google scholar] [Indexed]
- Massillon-Jl G, Zuniga-Meneses L (2010) The response of the new MD-V2-55 radiochromic film exposed to 60Co gamma rays. Phys Med Biol 55: 5437-5449.
[Crossref] [Google scholar] [Indexed]
- Rink A, Lewis DF, Varma S, Vitkin IA, Jaffray DA (2008) Temperature and hydration effects on absorbance spectra and radiation sensitivity of a radiochromic medium. Med Phys 35: 4545-4555.
[Crossref] [Google scholar] [Indexed]
- Lynch BD, Kozelka J, Ranade MK, Li JG, Simon WE, et al. (2006) Important considerations for radiochromic film dosimetry with flatbed CCD scanners and EBT Gafchromic® film. Med Phys 33: 4551-4556.
[Crossref] [Google scholar] [Indexed]
- Gafchromic™ EBT3 radiotherapy films. ashland.com.
- Williams MJ, Metcalfe PE (2011) Radiochromic film dosimetry and its applications in radiotherapy. AIP Conf Proc 1345: 75-99.
- Watanabe Y, Patel GN, Patel P (2006) Evaluation of a new self-developing instant film for imaging and dosimetry. Radiat Prot Dosimetry 120: 121-124.
[Crossref] [Google scholar] [Indexed]
- McLaughlin WL, Al-Sheikhly M, Lewis DF, Kovacs A, Wojnarovits L (1996) Radiochromic Solid-State Polymerization Reaction. ACS Symposium Series 620: 151-166.
- Andŕs C, del Castillo A, Tortosa R, Alonso D, Barquero R (2010) A comprehensive study of the Gafchromic EBT2 radiochromic film: A comparison with EBT. Med Phys 37: 6271-6278.
[Crossref] [Google scholar] [Indexed]
- Richley L, John AC, Coomber H, Fletcher S (2010) Evaluation and optimization of the new EBT2 radiochromic film dosimetry system for patient dose verification in radiotherapy. Phys Med Biol 55: 2601-2617.
[Crossref] [Google scholar] [Indexed]
- Reinhardt S, Hillbrand M, Wilkens JJ, Assmann W (2012) Comparison of Gafchromic EBT2 and EBT-3 films for clinical photon and proton beams. Med Phys 39: 5257-5262
[Crossref] [Google scholar] [Indexed]
- Micke A, Lewis DF, Yu X (2011) Multichannel film dosimetry with nonuniformity correction . Med Phys 38: 2523-2534.
[Crossref] [Google scholar] [Indexed]
- Mayer RR, Ma F, Chen Y, Miller RI, Belard A, et al. (2012) Enhanced dosimetry procedures and assessment for EBT2 radiochromic film. Med Phys 39: 2147-2155.
[Crossref] [Google scholar] [Indexed]
- Massillon-JLG, Chiu-Tsao ST, Munoz ID, Chan MF (2012) Energy Dependence of the New Gafchromic EBT3 Film: Dose Response Curves for 50 KV, 6 and 15 MV X-Ray Beams. Int J Med Phys Clin Eng Radiat Oncol 01: 60-65.
- Brown TAD, Hogstrom KR, Alvarez D, Matthews KL, Ham K, et al. (2012) Dose-response curve of EBT, EBT2, and EBT-3 radiochromic films to synchrotron-produced monochromatic x-ray beams. Med Phys 39: 7412-7417.
[Crossref] [Google scholar] [Indexed]
- Hammer CG, Rosen BS, Fagerstrom JM, Culberson WS, Dewerd LA (2018) Experimental investigation of Gafchromic® EBT-3 intrinsic energy dependence with kilovoltage x rays, 137Cs, and 60Co . Med Phys 45: 448-459.
[Crossref] [Google scholar] [Indexed]
- Borca VC, Pasquino M, Russo G, Grosso P, Cante D, et al. (2013) Dosimetric characterization and use of Gafchromic EBT-3 film for IMRT dose verification. J Appl Clin Med Phys 14: 158-171.
[Crossref] [Google scholar] [Indexed]
- Andŕs C, del Castillo A, Tortosa R, Alonso D, Barquero R (2010) A comprehensive study of the Gafchromic EBT2 radiochromic film: A comparison with EBT. Med Phys 37: 6271-6278.
[Crossref] [Google scholar] [Indexed]
- Constantinou C, Attix FH, Paliwal BR (1982) A solid water phantom material for radiotherapy x-ray and gamma-ray beam calibrations. Med Phys 9: 436-441.
- Devic S, Seuntjens J, Sham E, Podgorsak EB, Schmidtlein CR, et al. (2005) Precise radiochromic film dosimetry using a flat-bed document scanner. Med Phys 32: 2245-2253.
[Crossref] [Google scholar] [Indexed]
- Marroquin EYL, Gonzalez JAH, Lopez MAC, Barajas JEV, Garcia-Garduno OA (2016) Evaluation of the uncertainty in an EBT-3 film dosimetry system utilizing net optical density. J Appl Clin Med Phys 17: 466-481.
[Crossref] [Google scholar] [Indexed]
- Devic S, Tomic N, Soares CG, Podgorsak EB (2009) Optimizing the dynamic range extension of a radiochromic film dosimetry system. Med Phys 36: 429-437.
[Crossref] [Google scholar] [Indexed]
- Melhus T, Hellberg F (2021) Characterization of Gafchromic EBT-3 film calibration for high-accuracy applications. P: 32.
- Holm KM, Yukihara EG, Ahmed MF, Greilich S, Jakel O (2021) Triple channel analysis of Gafchromic EBT-3 irradiated with clinical carbon-ion beams. Physica Medica 87: 123-130.
[Crossref] [Google scholar] [Indexed]

Open Access Journals
- Aquaculture & Veterinary Science
- Chemistry & Chemical Sciences
- Clinical Sciences
- Engineering
- General Science
- Genetics & Molecular Biology
- Health Care & Nursing
- Immunology & Microbiology
- Materials Science
- Mathematics & Physics
- Medical Sciences
- Neurology & Psychiatry
- Oncology & Cancer Science
- Pharmaceutical Sciences