CT Simulation Effective Doses of Breast Cancer Patients and Chest CT Effective Doses Measurements for a Particular Healthcare Institute of Bangladesh
Juwel Hosen1, Abul Hasnat2, Jakir Hosen3, Mannu Bardhan Paul4, Masud Parvej2, Rayhan Alam4, Fatema Tuz Zohra5, Khairul Islam1 and M Monjur Ahasan6
1.Department of PET-CT Instrumentation and Management, Institute of Nuclear Medical Physics, Bangladesh Atomic Energy Commission, Dhaka, Bangladesh. 2.Department of Dosimetry, Institute of Nuclear Medical Physics, Bangladesh Atomic Energy Commission, Dhaka, Bangladesh. 3.Department of Radiotherapy, Institute of Nuclear Medical Physics, Bangladesh Atomic Energy Commission, Dhaka, Bangladesh. 4.Department of Cyclotron and Radiochemistry, Institute of Nuclear Medical Physics, Bangladesh Atomic Energy Commission, Dhaka, Bangladesh. 5.Department of Nuclear Medicine, Institute of Nuclear Medical Physics, Bangladesh Atomic Energy Commission, Dhaka, Bangladesh. 6.Department of Health Physics, Atomic Energy Centre, Bangladesh Atomic Energy Commission, Dhaka, Bangladesh.
Published Date: 2022-09-26DOI10.36648/2574-285x.7.5.24
Juwel Hosen1*, Abul Hasnat2, Jakir Hosen3, Mannu Bardhan Paul4, Masud Parvej2, Rayhan Alam4, Fatema Tuz Zohra5, Khairul Islam1 and M Monjur Ahasan6
1Department of PET-CT Instrumentation and Management, Institute of Nuclear Medical Physics, Bangladesh Atomic Energy Commission, Dhaka, Bangladesh.
2Department of Dosimetry, Institute of Nuclear Medical Physics, Bangladesh Atomic Energy Commission, Dhaka, Bangladesh.
3Department of Radiotherapy, Institute of Nuclear Medical Physics, Bangladesh Atomic Energy Commission, Dhaka, Bangladesh.
4Department of Cyclotron and Radiochemistry, Institute of Nuclear Medical Physics, Bangladesh Atomic Energy Commission, Dhaka, Bangladesh.
5Department of Nuclear Medicine, Institute of Nuclear Medical Physics, Bangladesh Atomic Energy Commission, Dhaka, Bangladesh.
6Department of Health Physics, Atomic Energy Centre, Bangladesh Atomic Energy Commission, Dhaka, Bangladesh.
- *Corresponding Author:
- Juwel Hosen
Department of PET-CT Instrumentation and Management,
Institute of Nuclear Medical Physics, Bangladesh Atomic Energy Commission, Dhaka,
Bangladesh.
E-mail: juwelchem@baec.gov.bd
Received date: August 31, 2022, Manuscript No. IPIMP-22- 14510; Editor Assigned date: September 01, 2022, PreQC No. IPIMP-22- 14510 (PQ); Reviewed date: September 12, 2022, QC No. IPIMP-22- 14510; Revised date: September 19, 2022, Manuscript No. IPIMP-22- 14510 (R); Published date: September 26, 2022, DOI: 10.36648/2574-285x.7.5.24
Citation: Hosen J, Hasnat A, Hosen J, Paul MB, Parvej M et al. (2022) CT Simulation Effective Doses of Breast Cancer Patients and Chest CT Effective Doses Measurements for a Particular Healthcare Institute of Bangladesh. J Med Phys Appl Sci Vol.7 No 5: 24
Abstract
CT scan has become a popular tool, widely used in detection, monitoring and guide procedures like biopsy, radiotherapy etc. Simultaneously, this technique yields to high radiation exposure to the patient body along with its beneficial purposes. The Dose Length Product (DLP) of breast cancer patients during Computed Tomography (CT) simulation and normal chest CT scan were measured to calculate patient effective dose. Effective doses from CT simulations of breast cancer patients have been measured. From this data, a radiation risk assessment has been developed between the two tests, CT simulation for therapeutic purpose and Chest CT scan. Forty nine female patients were introduced for CT simulation. Volumetric CT Dose Index (CTDIvol) was 13.1 mGy using 32 cm phantom as reference. The length of neck, chest and abdomen was 11.29 ± 2.22 cm, 22.15 ± 2.40 cm and 10.43 ± 4.54 cm respectively. From CTDIvol and length the calculated DLP of neck, chest and abdominal region were 136.67 ± 59.45 mGy.cm, 290.22 ± 31.54 mGy.cm and 147.87 ± 29.13 mGy.cm. Effective dose for chest CT and CT simulation of breast cancer patients were as follows: chest CT 4.06 ± 0.44 mSv and CT simulation 7.89 ± 0.86 mSv. For comparative Ttest of effective doses the p-value was<0.001. The results of this study will facilitate establishing Diagnostic Reference Levels (DRLs) of effective dose due to CT simulation of breast cancer patients and chest CT scan in Bangladesh.
Keywords
Effective dose; Dose length product; CT stimulation; Diagnostic reference levels
Introduction
After introducing Computed Tomography in diagnostic radiology, the most widely used imaging modality is still CT [1]. Radiation doses in CT are larger than conventional X-ray imaging techniques [2]. As a high dose diagnostic procedure CT has been classified by the European Union ionizing radiation protection directive and suggested to optimize the patient dose [3]. So the risk analysis and understanding patient population dose is a timely topic as ionizing radiation may cause cancer [4].
Stochastic effect and deterministic effect are two major types of risk in ionizing radiation [5]. For risk analysis, the patient population effective dose measurement has become a popular technique; moreover it will be used to conduct associative effective dose values with other known or relatable population effective dose values [6]. Effective dose shows only the value considering given exposure conditions, not the characteristics of a specific individual.
Effective dose describes the somatic dose development
where differences in biological tissue sensitivity to ionizing
radiation are reflected [7]. For human body, the weighted
summation of measured organ dose (DT,R) is defined as effective dose  [8]. Weighting factors vary according to different types of radiation and tissue types. The International
Commission on Radiological Protection (ICRP) introduced the
tissue-weighting factor to calculate effective dose. The updated
weighting factors for 30 organs and tissues of the human body
were published in 2007 by ICRP [9]. Software based Monte Carlo
methods and Dose-Length Product (DLP) with sets of age and body region specific k-factors are two
common practices to calculate effective dose for CT [10,11].
Initially, the data used to derive k-factors were collected from
the united kingdom’s national radiological protection board
monte carlo organ dosimetry program developed in 1991 and
updated in 2002 [12,13]. DLP denotes the total amount of
radiation used during CT scan and it is calculated by multiplying
CTDIvol with scan length. CTDIvol expresses the intensity of the
radiation emitted by a CT device. It describes the radiation
exposure on average per-section in reference to 16 cm or 32 cm
cylindrical phantom that's why CTDIvol is not related to patient
size, it does not show the actual amount of radiation the patient
is being exposed to [14].
About 60% of the patients treated at Institute of Nuclear Medical Physics (INMP) are afflicted with carcinoma in breast. In modern radiotherapy techniques CT simulation is the prerequisite for contouring, treatment planning and treatment delivery procedure. Patients may have regional or distant metastasis, so at time of CT simulation of breast cancer patient’s the scan area is considered from nose to abdomen which is larger than normal chest CT scan area. After successful completion of radiotherapy, very few of the patients came with secondary carcinoma which may have occurred due to radiation effect of radiotherapy or radiation of CT simulation. For risk analysis of radiation induced carcinoma a proper radiation monitoring is necessary either the radiation exposure due to therapy or CT scan.
The purpose of this study was to measure the DLP of breast cancer patients during CT simulation and normal chest CT scan at INMP to calculate and compare effective doses. These radiation dose parameters could be used to set Diagnostic Reference Levels (DRLs) in Bangladesh. Only adult female patients are considered in our study.
Experimental Methods
Patient setup for CT simulation
To determine the exact location, shape and size of a tumor, CT simulation processes are carried out. The main purpose of CT simulation is to assist the radiotherapy team in the treatment planning process. In 2021 around 60 breast cancer patients were subjected to CT simulation for radiotherapy purposes at Institute of Nuclear Medical Physics (INMP). Effective doses were calculated from 49 breast cancer patients who underwent CT simulation. The average age of the patients were 47.2 (± 10.4) years. All patients were scanned using a helical CT, Philips ingenuity TF PET/CT system. The patients are placed on the couch in a Plexiglas cradle gripping vertical handles above the head in a comfortable position [15]. The device was fitted in a 70 cm bore of CT gantry. For isocenter definition and to define caudal and cephalad margins of the tangential fields radioopaque markers were appointed on the patient's skin. When the image reconstruction had been completed, for treatment planning and treatment the isocenters and alignment points were sketched on the patient’s skin [16].
CT Simulation Parameters
A CT scanner with flat table top, laser positioning and marking system, simulation software, hardcopy output CT-linked 3D treatment planning system are combinedly make a CT simulator [17]. Rather than a dedicated CT-simulator at INMP we used a 128 slice PET-CT system (Philips Ingenuity ToF) for CT simulation. The detailed parameters of our system during CT simulation were as follows (Table1).
| CT Parameters | Value | CT Parameters | Value |
|---|---|---|---|
| Slice thickness | 2.5 mm | Detector Coverage | 40 mm |
| Tube Voltage | 120 kV | Pitch | 0.704 |
| Tube Current | 200 mAs | Gantry Rotation Time | 0.4 sec |
| Field of View | 700 mm | Table Speed | 67.0 mm/sec |
| iDose Level | 3 | CTDIvol | 13.1 mGy |
CTDIvol, volumetric computed tomography dose index.
Table 1: CT simulation parameters.
Data Acquisition from CT Console
The patients were introduced into a rotating x-ray beam and detector set in helical CT at INMP. The x-ray beam from the CT tracks down a helical path in the patient viewpoint. Then three dimensional data sets for the consequence of helical path were reconstructed into sequential images for a stack [18]. Among 60 patients, for our study purposes we selected 49 patients by excluding those who had multiple metastasis covering nearly the entire body. Radiation oncologists guided us to set the CT scan area. Since patients may have regional or distant metastasis, at time of CT simulation of breast cancer patient’s the scan area is considered from nose to abdomen. Scans were performed by maintaining tube potential 120 kV which is our regular practice except bulky patients. Radiation dose parameters of CT simulation were collected from the console computer. For CT simulation of breast cancer patients 32 cm phantom size was taken as reference. Volumetric CT dose index (CTDIvol) was recorded.
Data Acquisition from TPS
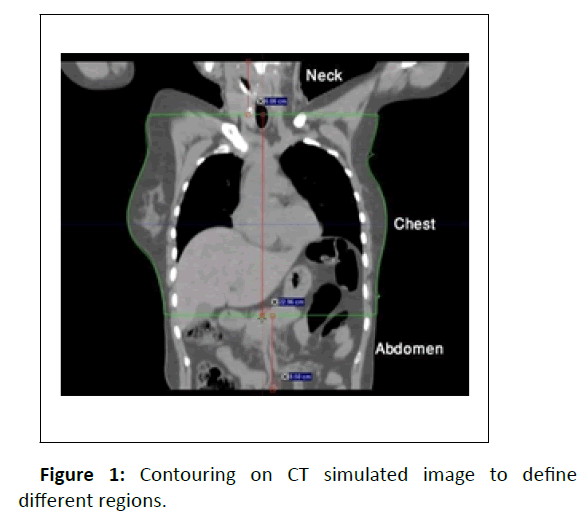
The first step in the treatment planning process is patient data acquisition. Therefore, CT simulated data is imported to the treatment planning system which was sent from the CT console. Oncologist contoured the Gross Tumor Volume (GTV), Clinical Target Volume (CTV). Physicists defined the Planning Target Volume (PTV) and made the plans for the treatment. At INMP Somavision software is used for contouring and Eclipse 13.7 is used for treatment plans. Plans were approved and patients were treated accordingly. Later for the study purpose oncologists copied the CT image series and contoured the normal chest CT scanning area [19]. On the basis of that contouring, the neck and abdominal portion were fragmented. The length of neck, chest and abdominal region were measured by using distance measuring scale in TPS software. These body region specific lengths were used to calculate Dose Length Product (DLP) and Effective Dose (ED) (Figure 1).
Effective Dose Measurements
DLP is the parameter which represents all the energies absorbed in the phantom bearing the unit mGy.cm [20]. Effective doses were calculated by using DLP and sets of age and body region specific k-factor using following equation [21]

Where, k is coefficient of unit mSv/mGy.cm to convert DLP into effective dose and DLP is the product of CTDIvol and scan length.
Statistical Analysis
We made a comparison between effective dose of CT chest and effective dose of CT simulation and calculated their average and standard deviation. For comparison we also performed a statistical analysis named T-test. P value of less than 0.05 was considered to indicate a statistically significant data comparison for 95% data. MS Excel and SPSS software (version 25, IBM corporation) were used for data analysis.
Results
49 CT simulations were performed where all the patients were female. The mean ± SD age of the patient who underwent CT simulation was 47.22 ± 10.36 years (minimum and maximum age was 25 years and 73 years respectively).
CTDIvol and DLP
CTDIvol was 13.1 mGy using 32 cm phantom as reference. Length of the chest region was measured 22.15 ± 2.40 cm. From CTDIvol and chest length the calculated DLP for the chest region was 290.22 ± 31.54 mGy.cm. Due to CT simulation of breast cancer patients for radiotherapy extended areas were administered for CT. The average length of neck and abdominal region was 11.29 ± 2.22 cm and 10.43 ± 4.54 cm respectively. In those cases the DLP for neck and abdominal region was 136.67 ± 59.45 and 147.87 ± 29.13 mGy.cm.
Effective Dose
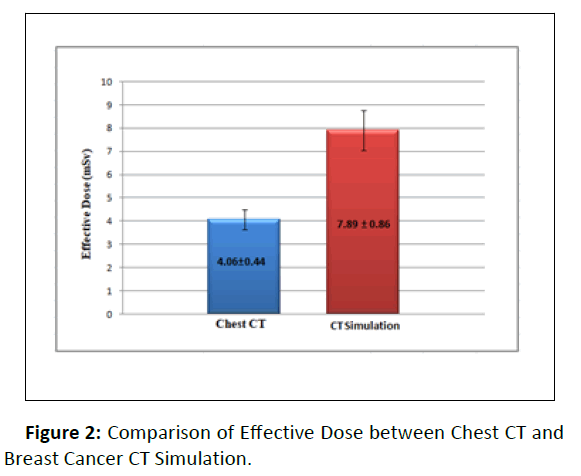
Effective dose for chest CT and CT simulation of breast cancer patients were as follows: chest CT 4.06 ± 0.44 mSv and CT simulation 7.89 ± 0.86 mSv. For comparative T-test of effective dose the p-value was <0.001(Figure 2).
Discussion
In this study, radiation dose parameters of the breast cancer patient’s CT examinations of a single center in Bangladesh are reported. Cancer risk of CT examinations is reflected by the description of effective dose value. Several former studies clearly depict that the effective dose can easily be estimated from the DLP by multiplying with a suitable k-factor for different body regions [22]. Age and gender have also been accounted for k-factor values.
According to the latest publication of International Commission on Radiology Protection (ICRP), DRLs is the inspection tool to help in optimization of protection from ionizing radiation exposure in clinical diagnostic and interventional procedures.
Particularly high or low radiation dose in routine examinations for a speci ied test can be evaluated from this. In this publication typical radiation dose parameters are de ined as the mean ± SD of the total data for a DRLs quantity from CT examinations in a particular institution. To set the local DRLs minimum 10 institutions are needed.
Three radiation dose parameters CTDIvol, DLP and Effective dose are reported where CTDIvol, DLP, and Effective dose are measured in milligray (mGy), milligray.cm (mGy.cm), and millisievert (mSv), respectively. Among these the CTDIvol and DLP are collected from CT instruments using proper patient protocol. To compare radiation doses with national and international DRLs in CT test, the above mentioned three parameters can easily be used.
Primarily the intensity of the radiation emitted by a CT device is indicated by CTDIvol where 16 or 32 cm cylindrical phantom is used as reference. Normally 32 cm phantom is used for chest and abdomen scan of adults and 16 cm phantom is used for head & neck and pediatric patients [23].
But in our calculation we selected 32 cm phantom as a reference for neck study also because we performed CT simulation from abdomen to nose in a single scan. According to walter huda to measure the effective dose of the neck region by using 32 cm phantom as a reference instead of 16 cm phantom the DLP value connected with 32 cm phantom was multiplied by two [24].
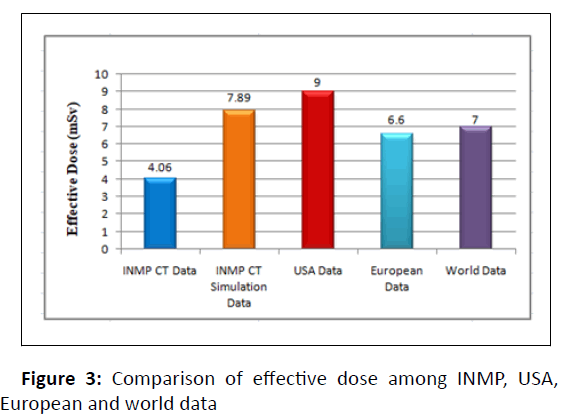
In reference to the USA data, the effective dose value for chest CT of our institute (4.06 ± 0.44) is signi icantly lower than USA value (9 mSv) [25], meanwhile, the effective dose for breast cancer CT simulation (7.89 ± 0.86) is also lower than usa chest CT value (9 mSv). Compared to European (6.6 mSv) and worldwide (7 mSv) effective doses of chest CT, at our institute the effective dose of chest CT (4.06 ± 0.44) is lowered by around 3 mSv [26, 27], whereas the effective dose for CT simulation of breast cancer patients (7.89 ± 0.86) is higher than European and worldwide E value of chest CT (Figure 3).
To calculate effective dose from DLP, in our study we used the conventional k-factors derived using tissue weighting factors of ICRP report 103 considering adult patients which are as follows: for chest region 0.014 mSv/mGy.cm, for abdomen 0.015 mSv/ mGy.cm and for neck area 0.006 mSv/mGy.cm [28]. But the existing k-factors derived with two limitations as keeping lack of realism the anatomical structures described by mathematical equations and stylized phantoms used as a reference are smaller or larger than the real patients [29]. In conventional morphological study, the average height and waist diameter of Bangladeshi females is smaller compared to larger physiques of European females, that's why the measured effective doses value in this study may have anomalies. To get more accurate data, first of all we need to estimate a size specific k-factor compatible with Bangladeshi females and this is a scope for further study regarding this work.
Conclusion
The evaluation of patient doses has been executed for CT simulation of breast cancer patients and normal chest CT scan. Effective dose for CT simulation is nearly doubled compared to chest CT scan. Smaller spatial size while considering organs of interest is the prime reason for this aberration. In this study, absorbed and effective dose are determined regarding the patients of INMP, Bangladesh. Determination of effective dose for CT simulation of breast cancer patients is first time in Bangladesh, thus minimum nine more institutional patient data is required to establish the national DRLs value for Bangladesh.
Acknowledgement
I would like to thank all the stuff of Institute of Nuclear Medical Physics, AERE, BAEC for their help and support throughout this work.
References
- Buzug TM (2011) Computed Tomography Springer Handb. Med Technol 311–342.
- Brenner DJ, Hall EJ (2007) Computed tomography-an increasing source of radiation exposure N Engl J Med 357: 2277–2284.
- https://eur-lex.europa.eu/legal-content/EN/TXT/PDF/?uri=CELEX:31996L0029&from=EN
- Shah DJ, Sachs RK, Wilson DJ (2012) Radiation-induced cancer: A modern view, Br J Radiol 85.
[Crossref],[Google Scholar],[Indexed]
- Mettler FA (2012) Medical effects and risks of exposure to ionising radiation J Radiol Prot 32
[Crossref],[Google Scholar],[Indexed]
- FP Castronovo (1993) An attempt to standardize the radiodiagnostic risk statement in an Institutional Review Board consent form. Invest Radiol 28: 533–538.
[Crossref],[Google Scholar],[Indexed]
- McCollough CH, Schueler BA (2000) Calculation of effective dose. Med Phys 27 828–837.
[Crossref],[Google Scholar],[Indexed]
- Pradhan AS, Kim JL, Lee JI (2012) On the use of effective dose (E) in medical exposures. J Med Phys 37: 63–65.
[Crossref],[Google Scholar],[Indexed]
- (2007) The 2007 Recommendations of the International Commission on Radiological Protection. ICRP publication 37: 1–332
[Crossref],[Google Scholar],[Indexed]
- Christner JA, Kofler JM, McCollough CH (2010) Estimating effective dose for CT using dose-length product compared with using organ doses: consequences of adopting International Commission on Radiological Protection publication 103 or dual-energy scanning. AJR Am J Roentgenol 194: 881–889.
[Crossref],[Google Scholar],[Indexed]
- G Jarry J, DeMarco U, Beifuss C, Cagnon M, Mc Nitt-Gray, A (2003) Monte Carlo-based method to estimate radiation dose from spiral CT: From phantom testing to patient-specific models. Phys Med Biol 48: 2645–63.
[Crossref],[Google Scholar],[Indexed]
- Jones DG, Shrimpton PC (1991) Survey of CT practice in the UK Pt 3, United Kingdom.
- Khursheed A, Hillier MC, Shrimpton PC, Wall BF(2002) Influence of patient age on normalized effective doses calculated for CT examinations. Br J Radiol 75: 819–830.
[Crossref],[Google Scholar],[Indexed]
- Huda W, Mettler FA (2011) Volume ct dose index and dose-length product displayed during ct: what good are they?, Radiology 258: 236–242.
[Crossref],[Google Scholar],[Indexed]
- Jin M, Liu X, Ma J, Sun X, Zhen H (2021) The Impact of Different Simulation Modalities on Target Volume Delineation in Breast-Conserving Radiotherapy. Cancer Manag Res 13: 5633–5640.
[Crossref],[Google Scholar],[Indexed]
- Horst E, Schuck A, Moustakis C, Schaefer U, Micke O (2001) CT simulation in nodal positive breast cancer. Strahlenther Onkol 177: 511–516.
[Crossref],[Google Scholar],[Indexed]
- Hiraoka M, Mitsumori M, Okajima K, Nagata Y, Takahashi M et al. (1994) Use of a CT simulator in radiotherapy treatment planning for breast conserving therapy. Radiol Oncol 33: 48–55.
[Crossref],[Google Scholar],[Indexed]
- 18. Pande P, Mokal B, Joshi P, Patil N, Warrier J (2014) Data acquisition and image reconstruction in experimental computed tomography. Int J Electron Commun Instrum 4: 23–26.
- Bhalla AS, Das A, Naranje P, Irodi A, Raj V et al. (2019) Imaging protocols for ct chest: a recommendation. Indian J Radiol Imaging 29: 236–246.
[Crossref],[Google Scholar],[Indexed]
- McNitt-Gray MF (2002) AAPM/RSNA Physics Tutorial for Residents: Topics in CT. Radiogr. 22: 1541–1553.
[Crossref], [Google Scholar],[Indexed]
- Huda W, Ogden KM, Khorasani MR (2008) Converting dose-length product to effective dose at CT. Radiology. 248 995–1003.
[Crossref],[Google Scholar],[Indexed]
- McCollough CH, Christner JA, Kofler JM (2010) How effective is effective dose as a predictor of radiation risk?, AJR Am J Roentgenol 194: 890–896.
[Crossref],[Google Scholar],[Indexed]
- Strauss KJ, Goske MJ (2011) Estimated pediatric radiation dose during CT. Pediatr Radiol 41: p 472.
[Crossref],[Google Scholar],[Indexed]
- Huda W, Sterzik A, Tipnis S (2010) X-ray beam filtration, dosimetry phantom size and CT patient dose conversion factors. Phys Med Biol 55: 551–561.
[Crossref],[Google Scholar],[Indexed]
- Smith-Bindman R, Moghadassi M, Wilson N, Nelson TR, Boone JM, et al. (2015) Radiation doses in consecutive ct examinations from five university of california medical centers. Radiology. 277: 134–141.
[Crossref],[Google Scholar],[Indexed]
- European Commission (2014) Diagnostic Reference Levels in Thirty-six European Countries Luxemb. Publ Off Eur Union.
- Vilar-Palop J, Vilar J, Hernández -Aguado I, González-Álvarez I, Lumbreras B (2016) Updated effective doses in radiology, J Radiol Prot 36: 975–990.
[Crossref],[Google Scholar],[Indexed]
- Kobayashi M, Asada Y, Matsubara K, Haba T, Matsunaga Y (2015) Evaluation of effective dose using the k-factor of optimal scan range for Ct examination. Open J Radiol 5: 172–148.
- Romanyukha A, Folio L, Lamart S, Simon SL, Lee C(2016) Body size-specific effective dose conversion coefficients for CT scans. Radiat Prot Dosimetry. 172 428–437.
[Crossref],[Google Scholar],[Indexed]
Open Access Journals
- Aquaculture & Veterinary Science
- Chemistry & Chemical Sciences
- Clinical Sciences
- Engineering
- General Science
- Genetics & Molecular Biology
- Health Care & Nursing
- Immunology & Microbiology
- Materials Science
- Mathematics & Physics
- Medical Sciences
- Neurology & Psychiatry
- Oncology & Cancer Science
- Pharmaceutical Sciences


