Estimation of Radiation Dose to Thyroid Gland for patients Undergoing Brain Computed Tomography Examinations in Khartoum
Safea Hafez, Fathi Awad, E Mohamedahmed and Rekha Pachaiappan
1.Department of Medical Physics, Red Sea University, Port Sudan, Sudan 2.Department of Allied Health, Liwa College of Technology, Abu Dhabi, UAE 3. Consultant Radiologist Diagnostic Center (CRDC), Riyadh, Saudia Arabia 4.Tumors Therapy and Cancer Research Centre, Shendi University, Shendi, Sudan 5.Department of Medical Physics, Saveetha University, Chennai, India
Published Date: 2023-07-18DOI10.36648/2574-285x.8.2.35
Safea Hafez1, Fathi Awad2, E Mohamedahmed3,4and Rekha Pachaiappan5
1Department of Medical Physics, Red Sea University, Port Sudan, Sudan
2Department of Allied Health, Liwa College of Technology, Abu Dhabi, UAE
3Consultant Radiologist Diagnostic Center (CRDC), Riyadh, Saudia Arabia
4Tumors Therapy and Cancer Research Centre, Shendi University, Shendi, Sudan
5Department of Medical Physics, Saveetha University, Chennai, India
- *Corresponding Author:
- Fathi Awad
Department of Allied Health Professionals,
Faculty of Medical and Health Sciences,
Liwa College of Technology, Abu Dhabi,
UAE,
E-mail: fathi.hassan@ect.ac.ae
Recived date: July 03, 2023, Manuscript No. IPIMP-23-17025; Editor assigned date: July 05, 2023, Pre QC No. IPIMP-23-17025 (PQ); Reviewed date: July 10, 2023, QC No. IPIMP-23-17025; Revised date: July 13, 2023, Manuscript No. IPIMP-23-17025 (R); Published date: July 18, 2023, DOI: 10.36648/2574-285x.8.2.35
Citation: Hafez S, Awad F, Mohamedahmed E, Pachaiappan R (2023) Estimation of Radiation Dose to Thyroid Gland for Patients Undergoing Brain Computed Tomography Examinations in Khartoum. J Med Phys Appl Sci Vol.8 No.2: 35.
Abstract
As an imaging modality, Computed Tomography (CT) generates greater radiation doses compared to other diagnostic equipment. The requests of CT growth rapidly, accordingly radiation dose assessment and patients’ protection are critical. The aim of this study is to assess the radiation dose for patients undergoing brain CT examination in three major hospitals in Khartoum, Sudan. CT Expo software version 2.5 was used to calculate common CT Dose Descriptors: Volume dose index (CTDIvol), Dose–Length Product (DLP) and thyroid gland effective dose. The results showed that, the mean CTDIvol, DLP and effective dose for all patients in this study were 74.44 mGy, 1431.36 mGy × cm and 4.30 mSv respectively which is lower than that reported by other institutions. It is important to improve imaging technologists’ understanding of radiation dose in CT protocols and to obtain regular training with respect to optimization of radiation dose and reduction approach.
Keywords
Computed tomography; Brain; Radiation dose; Thyroid gland; Khartoum
Introduction
Radiation can be divided into two groups: Ionizing and nonionizing radiation, depending on the harm effect on the exposed tissues. X-rays is a common source of ionizing radiation which is extensively utilized at hospitals and research labs [1]. It is well documented that; a high dose of ionizing radiations can cause human deterministic effects as well as induction of cancer in various tissues [2]. Low radiation doses might potentially rise the risks of biological effects mainly for chronically irradiated or improperly protected workers [3].
Computed Tomography (CT) represents the main source of medical exposure from diagnostic imaging procedures. Despite the fact that CT imaging developed significantly and produce better right diagnosis of many conditions in comparison to other imaging techniques it raises the concern for persons exposed to high dose of radiation during imaging, that depends on age and sex [4-8].
Radiation dose management is needed in order to optimize imaging protocols and for tracking down and avoiding of imaging procedures with high radiation exposure. Two radiation dose indices in CT are used in radiation dose management, namely: The volume CT Dose Index (CTDIvol) and Dose Length Product (DLP). CTDIvol is an index of absorbed dose in the scan region and DLP represents an integral of CTDIvol over the longitudinal scan range and shows the overall radiation dose in an imaging series [9,10].
The Diagnostic Reference Levels (DRLs) was first introduced by the International Commission of Radiation Protection (ICRP) in 1996 [11]. DRLs are used to find cases in which radiation dosage is uncommonly, elevated [12]. It is recommended by the International Atomic Energy Agency (IAEA), IRCP and European Commission (EC) that CT examinations should be optimized by comparing of the patient doses with DRLs [12]. Such international organizations motivate individual countries to form their own DRLs as well as carry out regular monitoring for the DRL values. Furthermore, the ICRP recommended that the medical imaging practice to be surveyed by each country to establish its DRLs that will be utilized as indicators, issue guidance for optimization of radiation dose and provide justification of appropriate dose for a particular clinical implication [13,14].
The thyroid gland, which exposed to a serious scatter radiation because of its anatomical location, is considered as one of the most sensitive organs to ionizing radiation, and at highest risk of radiation induced cancer [15,16]. It is reported that medically irradiated patients, the accident of chernobyl reactor, survivors of the atomic bombing and radiation exposure in infancy can induce thyroid malignancy as well as benign thyroid nodules afterwards in life [17,18]. Furthermore, there are autoimmune reactions concerning the thyroid such as thyroid atrophy and hypothyroidism, which may be induced by radiation exposure [19].
In Sudan, the radiation dose for patients undergoing CT examinations was reported by some investigators. Suliman, et al., studied the updates on radiation exposure, and use the results in setting national diagnostic reference levels [20]. They found that the mean CTDIvol ranged: From 63.8 to 16.4 mGy in brain and a Kidney, Ureter and Bladder (KUB); respectively; mean DLP ranged from 1744 to 670 mGy × cm in CT Urography (CTU) and pelvic CT; respectively; while mean effective dose ranged from 21.71 to 1.96 mSv in CTU; respectively. Their results showed wide variations in technique and radiation dose for similar examinations indicating significant room for dose optimisation. Elnour, et al., reported the current CT of the chest– abdomen–pelvis radiation practice in Sudan [21]. They proposed DRLs are CTDIvol, 6 mGy and DLP, 970 mGy × cm, and an effective dose of 9.9 mSv. In addition, they found that the organ dose estimation showed that the thyroid received the highest dose during the scan. Naem, et al., investigated new data on patient doses for estimation purposes in CT examinations in Red Sea State [22]. Their study revealed that there are wide variations in patients’ doses within and between hospitals for CT.
To the best of our knowledge, there are no studies carried out in the radiation dose to thyroid gland from brain CT in Sudan. In this context, the aim of this study is to estimate the radiation dose to thyroid gland through CTDIvol and DLP as well as effective dose for patients undergoing brain CT examinations in three major hospitals in Khartoum, Sudan. Furthermore, the estimated doses will be compared to the previously published national and international studies.
Materials and Methods
Patients
This study was carried out on 67 patients (39 males and 28 females) who referred to Radiology Department for brain CT in Elzytona, Royal Care and ELmoalem hospitals in Khartoum State, Sudan. Patients without specific radiation dose reports were not included in the study. In addition, verbal informed consent was obtained from all the patients.
CT scanner
Three CT scanners were investigated in this study (one CT machine in each hospital). The specifications of each CT equipment are shown in Table 1. The image acquisition parameters according to sex are presented in Table 2.
| Hospital | Model | Number of slices |
|---|---|---|
| Elzytona | TOSHIBA scanner aquilion (model TSX-101A, the input 200 V 50/60 HZ, Max input power 100 KVA). | 64 |
| Royal care | TOSHIBA scanner aquilion (model TSX-101A, the input 200 V 50/60 HZ, Max input power 100 KVA). | 64 |
| ELmoalem | TOSHIBA scanner prime (model CXXG-012A), the input 200 V 50/60 HZ, Max input power 90 KVA). | 160 |
Table 1: CT equipment specifications.
| Gender | Age | Tube voltage (KVp) | Tube current (mA) | Pitch | Slice thickness (mm) | Number of slices | Slice length (cm) |
|---|---|---|---|---|---|---|---|
| Male | 47.3 ± 20.2 | 120 | 197.6 ± 42.11 | 0.98 | 5 | 650 ± 32 | 15 ± 2.17 |
| Female | 51.9 ± 20.9 | 120 | 217 ± 23.1 | 0.96 | 5 | 622±76.04 | 14.98 ± 2.01 |
Table 2: Image acquisition parameters according to sex.
Dose estimation
CT-Expo V 2.3 is an MS excel application written in visual basic for the calculation of patient dose in CT examinations. It allows the calculation of the following dose quantities; weighted CTDI, volume CTDI (effective CTDI), Dose-Length Product (DLP), organ doses, effective dose (according to ICRP 60 and 103). In contrast to similar programs for dose calculations in CT, CT-Expo V 2.3 offers the user a number of unique features, such as; dose calculations for all age groups (adults, children, neonates), dose calculations for each gender and dose calculations for all existing scanner models [23].
Data analysis
OriginPro 8 was used to perform statistical analysis. Categorical data is represented as frequencies with percentages. Mean ± Standard Deviation (SD) or median (Interquartile Range, IQR) was used for continuous data depending on normality.
Results and Discussion
The radiology community is becoming increasingly worried about the radiation dose resultant from the CT as its broad use has given rise to the radiation dose of the patients and consequently an increase in the prevalence of cancer mainly in thyroid as it is a sensitive organ to radiation [24].
It was reported that, CTDIvol represents a very practical way to correlate the doses delivered by different scan protocols or to attain a particular level of image quality for a particular patient size. In addition, with use of technique charts and diagnostic reference levels, CTDIvol can be utilized to set down the right dose for a particular patient size and diagnostic task [25]. Table 3 shows CTDIvol and DLP for all patients (males and females) in the studied hospitals. The mean values for the CTDIvol were 81.88, 76.96 and 61.88 mGy for Elzaytona, Royal Care and Elmoalem hospitals respectively and the highest value shown in Elzaytona hospital. Furthermore, the mean values for the DLP were 1721.15, 1369.71 and 1101.80 mGy × cm for Elzaytona, Royal Care and Elmoalem hospital respectively. From Table 3 it can be observed that Elzaytona hospital showed the highest DLP value. It was reported that, the elevated radiation dose for patients in CT depends on several factors such as, inappropriate exposure parameters, duplicated examinations, overlapped scans, and likely larger scan volume coverage [25].
| Hospital | CTDIvol (mGy) Mean ± SD (Min–Max) |
DLP(mGy × cm) Mean ± SD (Min–Max) |
|---|---|---|
| Elzaytona | 81.88 ± 5.94 (77.3-95.4) |
1721.15 ± 241.62 (1283.4-2190.6) |
| Royal care | 76.96 ± 10.33 (48.0-95.4) |
1369.71 ± 238.92 (772.8-1826.9) |
| Elmoalem | 61.88 ± 2.03 (59.50-65.40) |
1101.80 ± 289.64 (848.2-1394.9) |
| All patients | 74.44 ± 10.87 (48.00-95.40) |
1431.36 ± 363.32 (772.8-2190.6) |
Table 3: CTDIvol and DLP for all patients in hospitals.
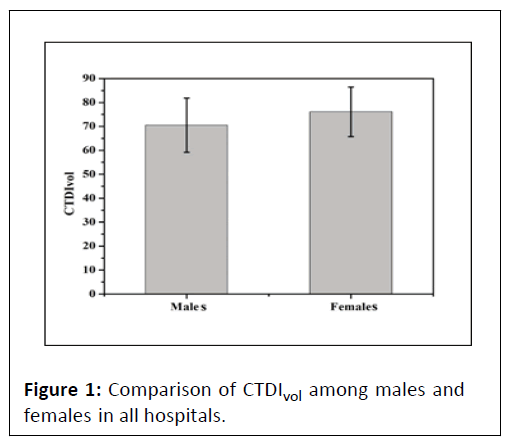
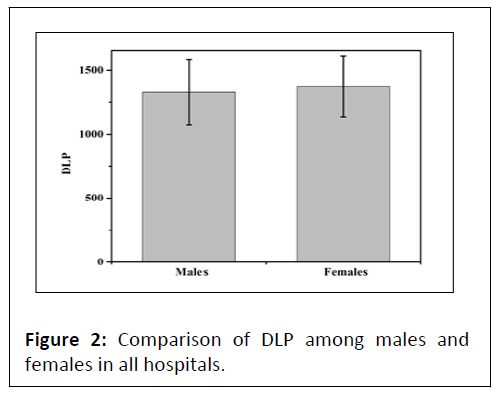
The CTDIvol and DLP were also classified according to sex in hospitals as shown in Table 4. The females showed higher mean CTDIvol (76.12) and DLP (1369.71) indices compared to the males. These comparisons are further illustrated by Figures 1 and 2.
| Gender | CTDIvol (mGy) Mean ± SD (Min-Max) |
DLP(mGy × cm) Mean ± SD (Min-Max) |
|---|---|---|
| Male | 70.5 ± 11.34 (48-80.8) |
1327.28 ± 254.23 (772.8-1826.9) |
| Female | 76.12 ± 10.33 (59.5-95.4) |
1369.71 ± 238.92 (772.8-1826.9) |
Table 4: CTDIvol and DLP for males and females in all hospitals.
| Hospital | Mean ± SD | (Min-Max) |
|---|---|---|
| Elzaytona | (5.60 ± 1.80) | (2.9-9.4) |
| Royal care | (3.59 ± 1.04) | (1.5-6.2) |
| Elmoalem | (3.30 ± 0.65) | (1.8-4.60) |
| All patients | (4.30 ± 1.70) | (1.50-9.40) |
Table 5: Effective dose (mSv) of thyroid for all patients in hospitals.
Effective dose was originally evolved by the (ICRP) as a riskadjusted dosimetric quantity in order to the manage the protection against stochastic effects, mainly cancer, facilitating comparison of intended or received doses with dose constraints, dose limits and reference levels indicated in the same quantity [26].
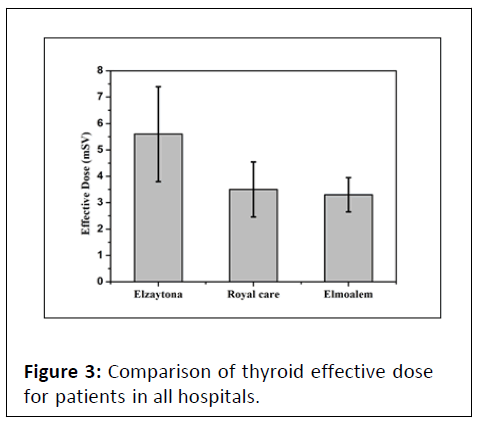
The effective doses of the thyroid for all patients in the three hospitals are shown in Table 5. The highest and lowest effective dose values were 5.60 and 3.30 mSv in Elzaytona and Elmoalem hospitals respectively. Figure 3 represents a comparison of the effective dose among the studied hospitals. Furthermore, the effective dose values were also classified according to the sex. There are no differences for the effective doses among both males (3.50 mSv) and females (3.53 mSv) as we can notice in Table 6. These values are less than that reported by Hiba et al., as they found that the mean effective dose for patients undergoing brain CT examinations in Khartoum is 5.48 and 5.99 mSv for males and females respectively [27]. It was further reported that head CT scanning is commonly related, with high doses of radiation with the effective dose spanned from 1.2 to 8.8 mSv for procedure [28].
| Gender | Mean ± SD | (Min-Max) |
|---|---|---|
| Males | 3.50 ± 1.02 | 1.50-6.20 |
| Females | 3.53 ± 1.04 | 1.50-6.20 |
Table 6: Effective dose (mSv) of thyroid for males and females’ patients in all hospitals.
We have compared the CTDIvol and DLP that we estimate in this study with other national and international published works from Sudan, Ethiopia, Morocco, Nigeria, Egypt, Iraq, Japan, Northern Ireland and Taiwan (Table 7).
| Study | CTDIvol (mGy) | DLP (mGy × cm) |
|---|---|---|
| Present study | 74.44 | 1431.36 |
| Sudan 2016 [20] | 63.8 | 1744 |
| Ethiopia 2023 [29] | 43.27 | 988.52 |
| Morocco 2021 [30] | 57.4 | 1020 |
| Nigeria 2018 [31] | 61 | 1310 |
| Egypt 2017 [32] | 30 | 1360 |
| Iraq 2016 [33] | 84.68 | 1642.76 |
| Japan 2015 [34] | 85 | 1350 |
| Northern Ireland 2004 [35] | 60 | 1050 |
| Taiwan 2010 [35] | 72 | 850 |
Table 7: comparison of mean CTDIvol and DLP obtained in the present study with previously published papers for CT brain scan examinations.
From Table 7 we can observe that the lowest and highest mean CTDIvol were reported by Egypt (30 mGy) and Japan (85 mGy) respectively. Whereas the lowest and highest DLP were reported by Taiwan (850 mGy × cm) and Iraq (1642.76 mGy × cm) respectively. In addition, it can be noticed that, there is large variation in the CTDIvol and DLP values among these international institutions. There are many possible reasons why CT doses differ among hospitals. It is reported that different CT techniques are the primary. Furthermore, patients’ doses can be reduced by increasing pitch factor and reducing kVp and tube current [36,37]. In addition, imaging technologists training and attentions of CT scan technical aspects have substantial contribution in patient dose [38]. The imaging protocols used by the imaging technologists in different countries vary, and such variations are reliant on the experience and training of the operators.
Conclusion
We conclude that, the mean CTDIvol, DLP and effective dose for all patients in this study were 74.44 mGy, 1431.36 mGy × cm and 4.30 mSv respectively and found lower than that reported by other institutions. With convenient assessment of patient radiation dose, radiation awareness will be improved.
The exposure to ionizing radiation should be reduced and kept as low as reasonably achievable. CT imaging procedure depends on the operator; hence continuous training in CT operation and radiation safety is necessary.
References
- Brenner DJ, Doll R, Goodhead DT, Hall EJ, Land CE, et al. (2003) Cancer risks attributable to low doses of ionizing radiation: Assessing what we really know. Proc Natl Acad Sci 100: 13761-13766.
[Crossref],[Google Scholar], [Indexed]
- Cardis E, Vrijheid M, Blettner M, Gilbert E, Hakama M, et al. (2007) The 15-country collaborative study of cancer risk among radiation workers in the nuclear industry: Estimates of radiation-related cancer risks. Radiat Res 167: 396–416.
[Crossref],[ Google Scholar], [Indexed]
- Szumiel I (2015) Ionizing radiation-induced oxidative stress, epigenetic changes and genomic instability: The pivotal role of mitochondria. Int J Radiat Biol 91: 1-12.
[Crossref],[ Google Scholar], [Indexed]
- Brenner DJ, Hall EJ (2007) Computed tomography-an increasing source of radiation exposure. N Engl J Med 357: 2277-2284.
[Crossref],[ Google Scholar], [Indexed]
- Sun Z, Choo G, Ng KH (2012) Coronary CT angiography: Current status and continuing challenges. Br J Radiol 85: 495–510.
[Crossref], [Google Scholar], [Indexed]
- Collins L, Kalender W (2019) Managing patient dose in Multi-Detector Computed Tomography (MDCT). ICRP 32: 1-86.
- Mettler FA, Bhargavan M, Faulkner K, Gilley DB, Gray JE, et al. (2009) Radiologic and nuclear medicine studies in the united states and worldwide: Frequency, radiation dose, and comparison with other radiation sources- 1950-2007. Radiology 253: 520-531.
[Crossref],[Google Scholar], [Indexed]
- ICRP (2007) Radiological protection in medicine. Ann ICRP Publication 37: 1-64.
- ICRP (2007) Radiological protection in medicine. ICRP Publication 105 Ann.
- International Commission on Radiological Protection (ICRP) (2017) Diagnostic reference levels in medical imaging. ICRP Publication 135. Ann ICRP 46: 1–144.
- Vano E, Miller DL, Martin CJ, Rehani MM, Kang K, et al. (2017) ICRP Publication 135: Diagnostic reference levels in medical imaging. Ann ICRP46: 1-144.
[Crossref],[ Google Scholar], [Indexed]
- Vassileva J, Rehani M (2015) Diagnostic reference levels. AJR Am J Roentgenol 204: 1–3.
[Crossref],[ Google Scholar], [Indexed]
- Salama DH, Vassileva J, Mahdaly G, Shawki M, Salama A, et al. (2017) Establishing national Diagnostic Reference Levels (DRLs) for computed tomography in Egypt. Phys Medica 39: 16–24.
[Crossref],[ Google Scholar], [Indexed]
- Shrimpton PC, Hillier MC, Meeson S, Golding SJ (2011) Doses from Computed Tomography (CT) examinations in the UK-2011 Review.
- Donya M, Radford M, ElGuindy A, Firmin D, Yacoub MH (2014) Radiation in medicine: Origins, risks and aspirations. Glob Cardiol Sci Pract 4: 437-48.
[Crossref],[ Google Scholar], [Indexed]
- Sinnott B, Ron E, Schneider AB (2010) Exposing the thyroid to radiation: A review of its current extent, risks and implications. Endocr Rev 31: 756-773.
[Crossref],[ Google Scholar], [Indexed]
- Ron E, Brenner A (2010) Non-malignant thyroid diseases after a wide range of radiation exposures. Radiat Res 174: 877-888.
[Crossref],[Google Scholar], [Indexed]
- (1955) United Nations Scientific Committee on the Effects of Atomic Radiation (UNSCEAR) reports. Un-iLibrary: 211.
- Riley A, Green V, Cheah R, McKenzie G, Karsai L, et al. (2019) A novel microfluidic device capable of maintaining functional thyroid carcinoma specimens ex vivo provides a new drug screening platform. BMC Cancer 19: 259.
[Crossref],[Google Scholar], [Indexed]
- Suliman II, Mohamed M, Ahmed S, Osman I, Ahmed N (2016) Survey of CT practice in Sudan: Updates on radiation exposure and setting national diagnostic reference levels.
[Crossref],[ Google Scholar]
- Elnour AR, Barakat M, Tamam N, Sulieman AM, Dinar H (2021) Estimation of radiation risk and establishment of diagnostic reference levels for patients undergoing computed tomography chest–abdomen–pelvic examinations in Sudan. Radiat Prot Dosimetry 196: 104-109.
[Crossref],[ Google Scholar], [Indexed]
- Naem FL, Awad F, Salih (2017) Estimation of the patients doses in computed tomography in Red Sea State Red Sea University Journal of Basic and Applied Science.
- Stamm G, Nagel HD (2014) CT-Expo V 2.3 a tool for dose evaluation in computed tomography. Rofo 174: 1570-15706.
- Rydberg J, Buckwalter KA, Caldemeyer KS, Phillips MD, Conces DJ, et al. (2000) Multisection CT: Scanning techniques and clinical applications. Radiographics 20:1787: 1806.
[Crossref],[ Google Scholar], [Indexed]
- Almasri H, Inayyem W (2021) Evaluation of radiation doses for patients undergoing abdominopelvic computed tomography examination in palestine. J Health Phys 56: 75-79.
[Crossref],[ Google Scholar]
- Lee C (2020) How to estimate effective dose for CT patients. Eur Radiol 30: 1825-1827.[Google Scholar]
- Omer H, Alameen S, Mahmoud WE, Sulieman S, Nasir O, et al. (2021) Eye lens and thyroid gland radiation exposure for patients undergoing brain computed tomography examination, Saudi. J Biol Sci 28: 342-346.
[Crossref],[ Google Scholar], [Indexed]
- Mettler F, Mahesh M, Bhargavan-Chatfield M, Chambers CE, Elee JG, et al. (2020) Patient exposure from radiologic and nuclear medicine procedures in the united states: procedure volume and effective dose for the period 2006-2016. Radiology 295: 418-427.
[Crossref], [Google Scholar], [Indexed]
- Kumsa MJ, Nguse TM, Ambessa HB, Gele TT, Fantaye WG, et al. (2023) Establishment of local diagnostic reference levels for common adult CT examinations: a multicenter survey in Addis Ababa. BMC Med Imaging 23: 1-6.
[Crossref],[ Google Scholar], [Indexed]
- El Mansouri M, Talbi M, Choukri A, Nhila O, Aabid M (2022) Establishing local diagnostic reference levels for adult computed tomography in Morocco. Radioprotection 57: 61–66.
- Ekpo EU, Adejoh T, Akwo JD, Emeka OC, Modu AA, et al. (2018) Diagnostic reference levels for common Computed Tomography (CT) examinations: Results from the first Nigerian nationwide dose survey. J Radiol Prot 38: 525–35.
[Crossref],[ Google Scholar], [Indexed]
- Salama DH, Vassileva J, Mahdaly G, Shawki M, Salama A, et al. (2017) Establishing national Diagnostic Reference Levels (DRLs) for computed tomography in Egypt. Phys medica 39: 16–24.
[Crossref],[Google Scholar], [Indexed]
- Akbar A, Ehsan M, Mehran M (2016) Computed tomography dose index, dose length product and effective dose for head CT in Iraqi hospitals. Iraqi J Sci 4: 350-361.
- DRLs (2015) Diagnostic Reference Levels Based on Latest Surveys in Japan.
- Medical council, diagnostic reference levels, position paper, adopted by medical council 3 september 2004.
- McCollough CH (1996) Diagnostic reference levels. Wisley.
- Callahan MJ (2011) CT dose reduction in practice. Pediatr Radiol 41: 488-92.
[Crossref],[ Google Scholar], [Indexed]
- Maldjian PD, Goldman AR (2013) Reducing radiation dose in body CT: A primer on dose metrics and key CT technical parameters. Am J Roentgenol 200: 741–747.
[Crossref],[ Google Scholar], [Indexed]
- Lange I, Alikhani B, Wacker F, Raatschen HJ ( 2021) Intra individual variation of dose parameters in oncologic CT imaging. PLoS One 16: 0250490.
[Crossref],[Google Scholar], [Indexed]
Open Access Journals
- Aquaculture & Veterinary Science
- Chemistry & Chemical Sciences
- Clinical Sciences
- Engineering
- General Science
- Genetics & Molecular Biology
- Health Care & Nursing
- Immunology & Microbiology
- Materials Science
- Mathematics & Physics
- Medical Sciences
- Neurology & Psychiatry
- Oncology & Cancer Science
- Pharmaceutical Sciences


