Experimental Determination of Linear Attenuation Coefficient of Gamma Ray in Zinc Foil at Different Energies
Mathewos Dawana Desta, Mariam Tessema T, V K Mittal, Damene Darota Amamo
1Department of Natural Science, Wolaita Sodo University, Dawro Tarcha Campus, Sodo, Ethiopia
2Department of Natural Science, Post Graduate Research Coordinating Office, Jima University, Jima, Ethiopia
3Department of Physics, College Of Natural Science, Jima University, Ethiopia 4Department of Public Health, College of Medicine and Health Science, Wolaita Sodo University, Ethiopia
- *Corresponding Author:
- Mathewos Dawana Desta
Department of Natural Science, Wolaita Sodo University, Dawro Tarcha Campus, Ethiopia
Tel: 251920971655
E-mail: mathewosdawana01@gmail.com
Received date: March 02, 2020; Accepted date: March 23, 2020; Published date: April 3, 2020
Citation: Desta MD, Tessema MT, Mittal VK, Amamo DD (2020) Experimental Determination of Linear Attenuation Coefficient of Gamma Ray in Zinc Foil at Different Energies. Insights Med Phys Vol.5 No.1:6.
Copyright: © 2020 Desta MD, et al. This is an open-access article distributed under the terms of the Creative Commons Attribution License, which permits unrestricted use, distribution, and reproduction in any medium, provided the original author and source are credited.
Abstract
In this work, the spectra of gamma rays resulting from nuclear transitions of 22Na and 137Cs are collected by means of their interaction with matter. By varying the source with fixed distance from the detector and the presence of various thicknesses of absorbers different characteristics about the isotopes can be determined. Linear attenuation coefficient (μ) of gamma rays photons of energy for 0.662, 0.511 and 1.274 MeV in zinc have been determined experimentally through photon-transmission measurement performed under narrow collimated beam counting geometry with scintillation spectrometry as a photon detector. The experimentally obtained values of linear attenuation coefficient found to be in good agreement with the WINXCOM prediction. The Half Value Layer (HVL) and Tenth Value Layer (TVL) were calculated for Zinc foil. Linear attenuation coefficient represent a subject of considerable interest and importance, since it is required in solving various problems in a radiation physics, radiation dosimetry, industrial, biological, agriculture and medical studies.
Keywords
Linear attenuation coefficient; Half Value Layer (HVL); Tenth Value Layer (TVL)
Introduction
In 1896 Henri Becquerel found that uranium salts emitted nuclear radiation which was traced to natural radioactivity by the element uranium. This radiation can be in the form of particles (alpha and beta particles) or electromagnetic radiation (gamma rays). Radiation is further divided into particulate radiations and electromagnetic radiations. All particulate and electromagnetic radiations can interact with the atoms of an absorber during 102 fm. These wavelengths are far shorter than those of the other types of their passage through it, producing ionization and excitation of the absorber atoms [1]. Gamma radiations are electromagnetic radiations and no electric charge; they cannot be deflected by magnetic or electric fields. Gamma rays have energies typically in the range of 0.1 to 10 MeV and its frequency (f ≈ 1019-1024 Hz). Characteristics of the energies differs between nuclear states and those corresponding wavelengths between 104 and electromagnetic radiations [2]. Consequently, direct measurements of their energies with a magnetic spectrometry are not possible. But it is directly measured by scintillation and semiconductor detectors [3].
Gamma rays have 12 ways of interaction mechanisms. The three most dominant primary interaction mechanisms are photoelectric effect, Compton Scattering and Pair Production [4]. Rayleigh Scattering, Thomson Scattering by the Nucleus, Delbruck Scattering, Nuclear Resonance Scattering, Photodisintegration of Nuclei and Meson Production are another mechanisms of interactions due to minor effects but they are explainable in terms of just three most dominant one and three mechanism of inter actions are not yet have been observed [5].
When radiation passes through any material, its intensity gradually reduces as a result of a series of interactions. In 1982 Woods defined as linear attenuation coefficient which is the probability of a radiation interacting with a material per unit path length [6]. It is the important quantity characterizing the penetration and diffusion of gamma radiation in a medium.
Attenuation or shielding of gamma radiation is an important component of radiation safety programs aiming to reduce personnel exposure to ionizing radiation. Attenuation data for commonly used shielding materials is available in many resources, such at the NIST.WINXCOM database of attenuation coefficient, dosimetry, agriculture, industry, health physics and radiological health [7]. Berger and Hubbell have developed a computer program WINXCOM, which calculates photon crosssections and attenuation coefficient for pure elements and mixtures in the energy range of 1 keV to 100 GeV. Recently many researchers have been studied on determination of attenuation coefficient theoretically and experimentally for different materials. This mainly depends on the photon energy, the nature of the material and the density of medium [8]. In 1973 Goswami and Chaudhari have measured gamma ray attenuation coefficients very accurately for 34 elements from hydrogen to lead at six photon energies by using an extremely narrow collimated beam transmission method. Attenuation coefficients for human tissue using low energy photon radiation in the range 9.88-59.32 keV for 44 elements and tissues. An extensive data on linear and mass attenuation coefficients of gamma rays for some compounds and mixtures of dosimetric interest have been reviewed for 40 elements ranging from hydrogen (z=1) to uranium (z=92) for photon energies 1 keV to 20 MeV [9]. Recently, mass attenuation coefficients have been measured for building materials and different marbles.
Mass attenuation coefficient and linear attenuation coefficient of gamma rays photons of energy for 360-1330 keV in zinc have been determined experimentally through photon transmission measurement performed under narrow collimated beam counting geometry with scintillation spectrometry as a photon detector for multi gamma ray energy sources 133Ba, and 60Co has been studied [10]. A theoretical way to determine gamma-ray mass attenuation coefficient of zinc foil was determined by using FLUKA MC and XCOM [11]. Attenuation coefficient is the ultimate parameter to study the interaction of gamma radiation with matter. Whereas work is still in progress to find the linear and mass attenuation coefficients of elements, compounds and mixtures. Many workers conclude and accumulated the data of this parameter for different materials. A scientific study of interaction of radiation with matter demands a proper characterization and assessment of penetration and diffusion of gamma rays in the external medium. The study of various materials has been an important part of research in radiation chemistry, physics, agriculture and human health. The parameter attenuation coefficient usually depends upon the energy of radiations and nature of the material. In the present work the researcher determined the linear attenuation coefficient with varying zinc foil samples and calculated the HVL of zinc. The linear attenuation coefficient of zinc foil samples studied by using gamma sources at various gamma ray energies.
Materials and Methods
The lists of materials that used during this experiment were:
Gamma sources (22Na and 137Cs)
Scintillation detector NaI (Tl)
Multichannel analyzer
Measure-software.
Laptop (PC)
Pure zinc foils
Literatures
High power supply
NIST.WINXCOM Software
Caliper
Pre-amplifier
Amplifier
Origin-soft ware
Lead collimator
Experimental procedures
After set up the electronics in the arrangement we connected the NaI (Tl) detector (38B51 | 2-x) to its high voltage power supply with SHV connector, multichannel analyzer connected with detector by BNC connector and the computer connected with multichannel analyzer with USB cable. We checked all the connections. We made sure that the input of the linear amplifier was set on negative polarity. Set the high voltage supply to 0 V.
The pre-amplifier and a power supply were turned on for the detector.
The timer set was 3600 sec and the voltage made to the operating voltage was 600 milli volt (mV) found in laboratory. The computer was turned on and opened the Measure software program.
The background radiation without a radioactive source recorded three times and the average was taken. Radioactive source 137Cs placed in the lead block at 12 cm distance below of the NaI (Tl) detector.
The count (Io) was recorded three times and the average taken.
An absorber thickness measured and put between the source and detector then counted the gamma photons. The thickness of this is measured by the calipers provided to an accuracy of 0.1 mm.
The gamma photon Counted three times (I1,I2 and I3) the average taken.
Steps 6 and 7 with different thickness of the absorber were repeated.
The 137Cs source was removed and replaced the 22Na source in the slot. Steps from (5-10) were repeated for 22Na gamma source.
The linear attenuation coefficient were determined for each gamma source with different absorber thickness.
Graph plotted for ln(Io/I) versus thickness(x). The relation made a straight line and the attenuation law was verified.
The slope of the graph was found.
The linear attenuation coefficient calculated using equation. Note that, ρzn=7.13 g/cm3.
The HVL and TVL calculated by using equation.
Experimental set up
The electronically circuit of experimental work (Figure 1) that all the components connected together described below:
Result and Discussion
Data to verify the linear attenuation coefficient collected in this experiment using a gamma ray spectrometry that consists of a scintillation detector, high voltage supply, amplifier system and a multichannel analyzer to measure the energy distribution of the detected gamma rays.
Observation of some typical spectra
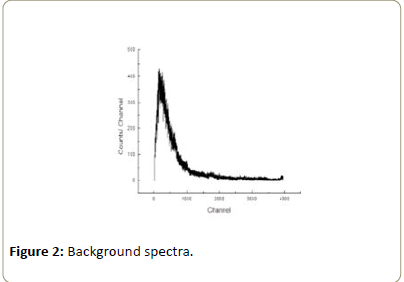
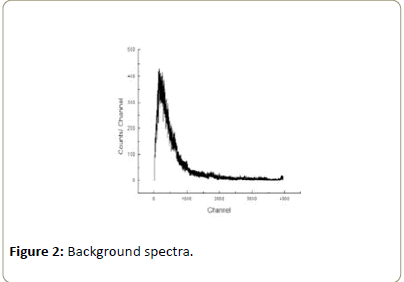
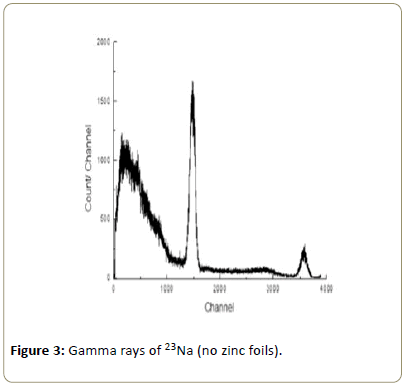
After set up the γ-ray spectrometry, γ-ray spectrum for background radiations was recorded for 3600 sec. This spectrum is shown in Figure 2. For recording γ-ray spectra the distance between the γ-ray source and detector was kept fixed at 12 cm. Gamma ray sources were collimated with lead collimator of diameter about 0.8 cm. First the γ-ray spectrum for 22Na was recorded without any zinc foil [12]. This is shown in Figure 3.
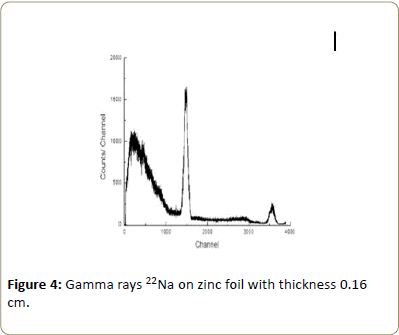
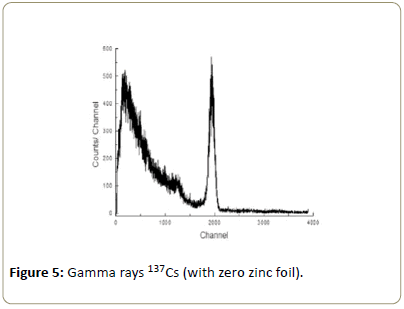
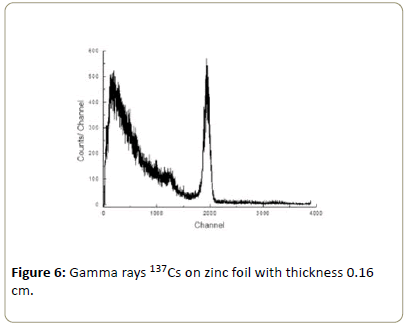
Then γ-ray spectra were recorded by placing Zinc foils of thicknesses 0.04, 0.08, 0.12 and 0.16 cm between source and detector. The γ-ray spectra with zinc foil of thickness 0.16 cm is shown in Figure 4. In the same way γ-ray spectra were recorded for 137Cs source. In Figure 5 γ-ray spectra for 137Cs is shown without any foil and in Figure 6 γ-ray spectra is displayed with Zinc foil of thickness 0.16 cm. All the spectra recorded three times.
Linear attenuation coefficient for zinc foil with 511, 662 and 1274 kev
After locating photo peaks, photo peak areas of all the peaks were evaluated after subtracting the compton continuum in Figures 3-6 counts from the background spectra in Figure 2 were also evaluated within the limit of photo peak. It was found that the background counts were about 1-2% of the photo peak counts and hence corrections are to background was neglected. For each γ-ray, area under the photo peak without foil (Io) and area (I) under the same energy peak with foils of different thickness were deduced [13]. These are shown in Tables 1-3. Finally the quantity log (Io/I) versus thickness with different foils were plotted.
| E(MeV) | Thickness (cm) | Net photopeak area | (Io/I) | ln(Io/I) |
|---|---|---|---|---|
| 0.511 | 0.04 | 16232 | 1.0244 | 0.0241 |
| 0.08 | 162527 | 1.0477 | 0.0466 | |
| 0.12 | 158774 | 1.0725 | 0.0699 | |
| 0.16 | 155415 | 1.0957 | 0.0914 | |
| 0.662 | 0.04 | 60220 | 1.0235 | 0.0232 |
| 0.08 | 59177 | 1.0415 | 0.0407 | |
| 0.12 | 58073 | 1.0619 | 0.0601 | |
| 0.16 | 56552 | 1.0898 | 0.0861 | |
| 1.274 | 0.04 | 28148 | 1.0131 | 0.0129 |
| 0.08 | 27700 | 1.0295 | 0.029 | |
| 0.12 | 27249 | 1.0465 | 0.0454 | |
| 0.16 | 26854 | 1.0619 | 0.0601 |
Table 1: Logarithmic function of net photo peak area of gamma ray 22Na and 137Cs with different absorber thickness. Experiment one [Io(511)=170281, Io(662)=61635 and Io(1274)=28516].
| E(MeV) | Thickness (cm) | Net photopeak area | (Io/I) | ln(Io/I) |
|---|---|---|---|---|
| 0.511 | 0.04 | 60546 | 1.0251 | 0.0247 |
| 0.08 | 59238 | 1.0477 | 0.0466 | |
| 0.12 | 57626 | 1.0769 | 0.0742 | |
| 0.16 | 56612 | 1.0963 | 0.0919 | |
| 0.662 | 0.04 | 59714 | 1.0211 | 0.0208 |
| 0.08 | 58457 | 1.043 | 0.0421 | |
| 0.12 | 57360 | 1.0629 | 0.0611 | |
| 0.16 | 56067 | 1.0875 | 0.0839 | |
| 1.274 | 0.04 | 8341 | 1.0117 | 0.0117 |
| 0.08 | 8149 | 1.0356 | 0.0349 | |
| 0.12 | 8043 | 1.0492 | 0.0481 | |
| 0.16 | 7931 | 1.0641 | 0.0621 |
Table 2: Experiment two where; Io(511)=62063, Io(662)=60972 and Io(1274)=8439.
| E(MeV) | Thickness (cm) | Net photopeak area | (Io/I) | ln(Io/I) |
|---|---|---|---|---|
| 0.511 | 0.04 | 58803 | 1.0233 | 0.0231 |
| 0.08 | 57471 | 1.047 | 0.0459 | |
| 0.12 | 56135 | 1.0719 | 0.0695 | |
| 0.16 | 54832 | 1.0974 | 0.0929 | |
| 0.662 | 0.04 | 58134 | 1.0209 | 0.0207 |
| 0.08 | 56983 | 1.0415 | 0.0407 | |
| 0.12 | 55690 | 1.0657 | 0.0636 | |
| 0.16 | 54629 | 1.0863 | 0.0829 | |
| 1.274 | 0.04 | 9244 | 1.0131 | 0.0129 |
| 0.08 | 9154 | 1.0295 | 0.029 | |
| 0.12 | 8954 | 1.0465 | 0.0454 | |
| 0.16 | 8841 | 1.0619 | 0.0601 |
Table 3: Experiment three where; [Io(511)=62175, Io(662)=59348 and Io(1274)=9390].
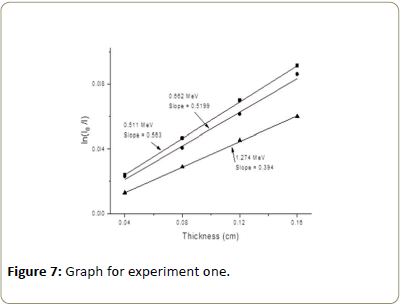
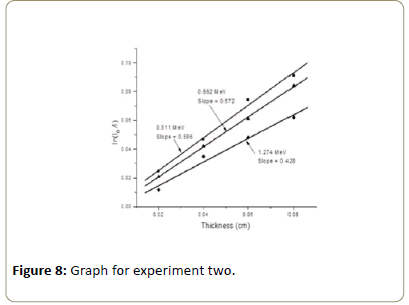
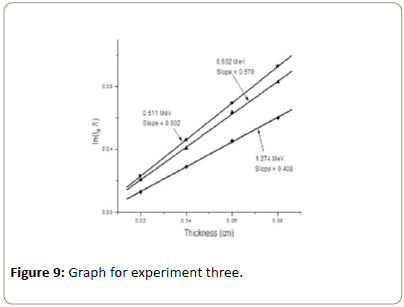
For a typical case this graph is shown in Figures 7-9 for 662, 511 and 1274 keV γ-rays. Slope of these straight lines gives the value of μ 3.3 data acquisition.
The aims of this experiment is to show the linear attenuation coefficient of the gamma ray interaction depend on energy of gamma rays. So to get the linear attenuation coefficient of gamma ray the important data needed are the photo peak area of gamma rays in different thickness of the Zinc foil [14]. These are shown in Tables 4-6.
| E(MeV) | Thickness (cm) | Photopeak area | Comp background | Net photopeak area |
|---|---|---|---|---|
| 0.511 | 0 | 203881 | 33600 | 170281 |
| 0.04 | 197332 | 31100 | 166232 | |
| 0.08 | 198869 | 36342 | 162527 | |
| 0.12 | 191624 | 32850 | 158774 | |
| 0.16 | 190015 | 34600 | 155415 | |
| 0.662 | 0 | 70968 | 9333 | 61635 |
| 0.04 | 68970 | 8750 | 60220 | |
| 0.08 | 69560 | 10383 | 59177 | |
| 0.12 | 68362 | 10325 | 58073 | |
| 0.16 | 65477 | 8925 | 56552 | |
| 1.274 | 0 | 33241 | 4725 | 28516 |
| 0.04 | 32578 | 4430 | 28148 | |
| 0.08 | 31783 | 4083 | 27700 | |
| 0.12 | 33024 | 5775 | 27249 | |
| 0.16 | 31754 | 4900 | 26854 |
Table 4: The total and net photo peak area of gamma ray 22Na and 137Cs with different absorber thickness, Experiment one.
| E(MeV) | Thickness (cm) | Photopeak area | Comp. background | Net photopeak area |
|---|---|---|---|---|
| 0.511 | 0 | 76713 | 14650 | 62063 |
| 0.04 | 72196 | 11650 | 60546 | |
| 0.08 | 70288 | 11050 | 59238 | |
| 0.12 | 69326 | 11700 | 57626 | |
| 0.16 | 68962 | 12350 | 56612 | |
| 0.662 | 0 | 70247 | 9275 | 60972 |
| 0.04 | 69398 | 9683 | 59714 | |
| 0.08 | 67616 | 9158 | 58457 | |
| 0.12 | 65760 | 8400 | 57360 | |
| 0.16 | 64817 | 8750 | 56067 | |
| 1.274 | 0 | 12039 | 3600 | 8439 |
| 0.04 | 12031 | 3750 | 8341 | |
| 0.08 | 12899 | 4750 | 8149 | |
| 0.12 | 11493 | 3450 | 8043 | |
| 0.16 | 11481 | 3550 | 7931 |
Table 5: Experiment two.
| E(MeV) | Thickness (cm) | Photopeak area | Comp. background | Net photopeak area |
|---|---|---|---|---|
| 0.511 | 0 | 75125 | 14950 | 60175 |
| 0.04 | 72403 | 13600 | 58803 | |
| 0.08 | 70421 | 12950 | 57471 | |
| 0.12 | 68885 | 12750 | 56135 | |
| 0.16 | 68532 | 13700 | 54832 | |
| 0.662 | 0 | 69265 | 9916 | 59348 |
| 0.04 | 68284 | 10150 | 58134 | |
| 0.08 | 67658 | 10675 | 56983 | |
| 0.12 | 65840 | 10150 | 55690 | |
| 0.16 | 63321 | 8691 | 54629 | |
| 1.274 | 0 | 13140 | 3750 | 9390 |
| 0.04 | 11794 | 2550 | 9244 | |
| 0.08 | 11954 | 2800 | 9154 | |
| 0.12 | 11754 | 2800 | 8954 | |
| 0.16 | 11441 | 2600 | 8841 |
Table 6: Experiment three.
Data analysis and discussion
Linear attenuation coefficient depends on the energy of incident photons and the nature of the absorbing material [15]. Linear attenuation coefficient decreases with increasing energy and attenuation increases with increasing thickness of the material and finally our findings showed that the half value layer of thickness that decreased the intensity to half. Tenth value layer was thickness of absorbing materials that decreased the photons transmitted beam intensity by a factor of 10.
Using the value of (Tables 4-7), the graph of ln(Io/I ) versus thickness was drawn as shown in the Figures 7-9 for zinc foil of linear attenuation coeffcients were obtained. And from the graph by using square fitting method, the slope of the graph was obtained. The slope equal to the linear attenuation coeffcients of material and their values are given in the Table 6.
| E(MeV) | Thickness (cm) | Average net photopeak area | (Io/I) | ln(Io/I) |
|---|---|---|---|---|
| 0.511 | 0.04 | 95193 | 1.0244 | 0.0241 |
| 0.08 | 93078 | 1.0477 | 0.0466 | |
| 0.12 | 90845 | 1.0725 | 0.0699 | |
| 0.16 | 88953 | 1.0957 | 0.0914 | |
| 0.662 | 0.04 | 59356 | 1.0235 | 0.0232 |
| 0.08 | 58205 | 1.0415 | 0.0407 | |
| 0.12 | 57041 | 1.0619 | 0.0601 | |
| 0.16 | 55749 | 1.0899 | 0.0861 | |
| 1.274 | 0.04 | 15244 | 1.0131 | 0.0129 |
| 0.08 | 15001 | 1.0295 | 0.029 | |
| 0.12 | 14748 | 1.0465 | 0.0454 | |
| 0.16 | 14542 | 1.0619 | 0.0601 |
Table 7: The average net photopeak area of gamma ray 22Na and 137Cs with different absorber thickness. [Io(511)=97506, Io(662)=60651 and Io(1274)=15448].
Dependence of attenuation on the thickness of the absorber
The result of total linear attenuation coeffcient measurement for zinc foils with different thickness plotted in the Figures 7-9 [16]. From the results it is seen that when the increasing thickness of absorber with fixed energy of gamma ray the attenuation also increase.
Dependence of linear attenuation coefficient on the gamma energy
In this case for different energies of gamma rays, the linear attenuation coefficient (μ) were obtained as it is shown in the Tables 8 and 9. The attenuation coefficient depends on the materials and on the energy of gamma rays. For a given material and monochromatic gamma rays linear attenuation coefficient will be constant. The result of total linear attenuation coefficient measurements are plotted in the (Figures 7-9). From the graph as it is shown the linear attenuation coefficient decreases as the energies increases. This is due to high penetration power of the gamma ray [17]. That mean, when the energy increased, the probability of interaction of gamma ray with the atomic electron decreases. As a result of this the linear attenuation coefficient decreases.
| Trail | Trail 1 | Trail 2 | Trail 3 | Mean (cm-1) | Mean/density (cm2/g) |
|---|---|---|---|---|---|
| 511 | 0.573 | 0.596 | 0.602 | 0.590 ± 0.041 | 0.066 ± 0.005 |
| 662 | 0.519 | 0.572 | 0.579 | 0.557 ± 0.039 | 0.662 ± 0.004 |
| 1274 | 0.394 | 0.428 | 0.408 | 0.410 ± 0.037 | 0.046 ± 0.004 |
Table 8: Experimental value of linear attenuation coefficient of gamma ray in zinc for three trials.
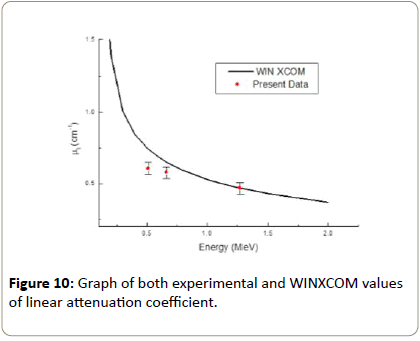
Comparison of experimental value and WINXCOM valueThe comparison of their measurement with the WINXCOM values [10] is done by calculating the percentage deviation as:
%deviation (Δ %)= μ (WINXCOM)− μ (Exp) μ (WINXCOM) × 100(0.0.1)
The variation of the experimental linear attenuation coefficient of zinc foil as a function of the photon energy is presented as shown in Table 9 and Figure 10. The result found that the deviation mostly below 10% shows a small difference with the WINXCOM values, where the linear attenuation coefficient for the various photon interaction process at the start is high and then decrease sharply with increase the photon energy. This is due to the dominance of the three main processes of incident energies [18]. The value of the measured linear attenuation coefficient value is in close agreement with an online data base of the reference linear attenuation coefficient from WINXCOM values [19]. Therefore, it can be applied to determine the linear attenuation coefficient of any type of elements. Figures 7-9 shows plot of ln(Io/I) versus thickness(x) for Zinc at 662, 511 and 1274 keV using this graphs, slope can be calculated and this slope is nothing but the (μ) is linear attenuation coefficient of element at that particular energy.
| E(MeV) | µexp (cm-1) | µxcomp (cm-1) | HVL | TVL |
| 0.511 | 0.590 ± 0.041 | 0.5807 | 1.2104 ± 0.0968 | 4.0208 ± 0.322 |
| 0.662 | 0.557 ± 0.039 | 0.513 | 0.3359 ± 0.1069 | 4.4377 ± 0.3550 |
| 1.274 | 0.410 ± 0.037 | 0.3715 | 0.7418 ± 0.1568 | 5.7861 ± 0.5207 |
Table 9: Experimental and WINXCOM value of linear attenuation coefficient of gamma ray in zinc.
Errors
Sources of random errors include counting statistics, uncertainties in sample thickness, and errors in applying sample impurity correction, shielding problem of a detector.
Conclusion
As experimentally observed, it was suggested that linear attenuation coefficient of gamma ray depends on the shielding materials, gamma photon source and geometry of the medium. Linear attenuation coefficient will be constant when a given material and monochromatic gamma rays. The present investigation confirms the theoretical values of linear attenuation coefficient for element are available from WINXCOM and the experimental measured values with theory encourage the theoretical considerations of the contributions of various processes such as photo electric effect, Compton scattering and the pair production. Due to the great contribution and role needed to work out in linear attenuation coefficient of gamma ray interaction with matter.
As we have worked out and discussed the results, we have successfully determined the solutions to the linear attenuation coefficient of the gamma ray in zinc foils including HVL and TVL. The measured linear attenuation coefficient, HVL and TVL of elements is useful for dosimetry and radiation shielding purpose.
References
- Saha GB (2006) Medical Physics and Radiobiology of Nuclear Medicine. Phys Rev 3: 56-190.
- Podogorsack EB (2005) Radiation Physics for Medical Physicists.
- James E Parks (2015) The compton effect, compton scattering and gamma rar spectroscopy.
- J Weily and Sons, Krane KS (1988) Introductory Nuclear Physics (2nd edn) Krane-Kenneth-S.
- Fano U. On the Theory of Ionization Yield of Radiation in Different Substances. Phy Review 70: 44-52.
- Robert E Krebs (2006) The history and use of our earths chemical elements. Chem Rev 2: 114-117.
- M Ragheb (2007) Radiation Physics (3rd edn) John Wiley and Sons.
- NIST(National Institute of Standards and Technology). X-ray mass attenuation coefficients (2013).
- Hubbell JH, Seltzer SM (1995) Tables of X-Ray of Mass attenuation coefficient and mass energy absorption coefficient 1 KeV to 20 MeV for elements Z=1 to 92 and 48 additional substances of dosimetric interest.
- Vandana A Tupe , Pawar PP, Shengule DR, Jadhav KM (2012) Gamma Ray Photon Interaction Studies of Zn in the Energy Range 360 - 1330keV photons. J App Sci India 4: 2191-2196.
- Elif EE, Ercan P, Cuneyt C (2015) Theorethical way to determine Gamma-ray mass attenuation coefficients of materials. Turk J phys 39: 1-27.
- Evans RD (1987)The Atomic Nucleus, TATA McGRaw-HILL, Bombay-New Delhi 15.
- Lilley J (2001) Nuclear physics principles and applications (3rd edn) John Wiley and Sons.
- Abdullah, Ramachandran, Joseph A, Varier KM, Joseph R, et al. (2008) Attenuation studies near k absorption edges using compton scattered 241Am gamma rays. Pramana Journal of Physics 70: 633-641.
- Karl EN,Thomas BG, David AK (2009) The Effect of Gamma ray Detector Energy Resolution on the Ability to Identify Radioactive Sources.
- Mittal VK, Verma RC, Gupta SC (2018) Introduction to Nuclear and Particle Physics (4th edn) Asoke KG.
- Canadian Nuclear Safety Commission (CNSC) Introduction to Radiation (2012).
- Singru RM (1974) Introduction to Experimental and Nuclear physics.
- Knoll GF (2006) Radiation detection and measurement (4th edn) John Wiley and Sons.
Open Access Journals
- Aquaculture & Veterinary Science
- Chemistry & Chemical Sciences
- Clinical Sciences
- Engineering
- General Science
- Genetics & Molecular Biology
- Health Care & Nursing
- Immunology & Microbiology
- Materials Science
- Mathematics & Physics
- Medical Sciences
- Neurology & Psychiatry
- Oncology & Cancer Science
- Pharmaceutical Sciences
