Frequency-Domain Weak-Signal Analysis for Bias-Controlled Medical Response Assessment
Jui-Hung Lu1* and Hung-Chiang Cheng2,3
1Department of Medicine, Power Health Rehabilitation and Integrative Medicine Clinic, Taipei, Taiwan 2Department of Acupuncture Science, Graduate Institute of Acupuncture Science, China Medical University, Taichung, Taiwan 3Department of Medicine, The School of Chinese Medicine for Post Baccalaureate, I-Shou University, Kaohsiung, Taiwan
Published Date: 2026-08-04Jui-Hung Lu1* and Hung-Chiang Cheng2,3
1Department of Medicine, Power Health Rehabilitation and Integrative Medicine Clinic, Taipei, Taiwan
2Department of Acupuncture Science, Graduate Institute of Acupuncture Science, China Medical University, Taichung, Taiwan
3Department of Medicine, The School of Chinese Medicine for Post Baccalaureate, I-Shou University, Kaohsiung, Taiwan
- *Corresponding Author:
- Jui-Hung Lu
Department of Medicine, Power Health Rehabilitation and Integrative Medicine Clinic, Taipei, Taiwan
E-mail: jackacy1010@gmail.com
Received date: June 30, 2026, Manuscript No. IPIMP-26-21173; Editor assigned date: July 02, 2026, PreQC No. IPIMP-26-21173 (PQ); Reviewed date: July 17, 2026, QC No. IPIMP-26-21173; Revised date: July 28, 2026, Manuscript No. IPIMP-26-21173 (R); Published date: August 04, 2026, DOI: 10.36648/2574-285X.11.1.94
Citation: Lu JH, Cheng HC (2026) Frequency-Domain Weak-Signal Analysis for Bias-Controlled Medical Response Assessment. J Med Phys Appl Sci Vol:11 No:1
Abstract
Context: Weak-signal instrumentation proposed for medical response assessment re-quires clear separation between descriptive signal changes, subjective user response, and therapeutic efficacy claims.
Objective: To evaluate whether a document-informed custom signal acquisition device produces reproducible frequency-domain differences across ambient, blank control, and labeled test-sample recordings, and to frame a bias-controlled path for pilot user feedback.
Methods: Sixteen-bit binary recordings were processed using bias removal, non-overlapping 2048-sample framing, Hann-windowed Fourier analysis, perframe median normalization, difference spectra, and per-bin effect-size estimation. A ten-participant anonymous, non-clinical feasibility feedback summary was reported descriptively.
Results: Ambient-air comparisons showed setup-dependent narrowband changes near 30–33 kHz. Blank-control versus test-sample comparisons showed repeated peaks at normalized frequencies near 0.095, 0.119, 0.167, 0.238, 0.333, and 0.489 cycles/sample, with typical shifts of 6–8 dB and within-recording Cohen’s d around 1.0–1.35. The test sample-A versus test-sample-B comparison was smaller, with a maximum shift of about 2.18 dB and |d| ≤ 0.50. Seven of ten participants favored the signal-conditioned eyedrop sample.
Conclusions: The findings support a reproducible exploratory signal-analysis work-flow and preliminary anonymous feasibility feedback. They should not be interpreted as validation of therapeutic efficacy.
Keywords
Weak-signal analysis; Medical response assessment; Spectral comparison; Fourier analysis; Sham control; Blinding; Eye drop preference feedback
Abbreviations
BPDE: Benzo[A]Pyrene Diol Epoxide; FFT: Fast Fourier Transform; IQR: Interquartile Range; VAS: Visual Analogue Scale
Introduction
A source design document supplied with the dataset describes a custom signal acquisition and conversion device that uses a magnetic element, a receiving stage, signal processing, and an output carrier to capture and retransmit very weak signals associated with a sample carrier [1]. Although the physical mechanism proposed in that source document is unconventional, the engineering problem it raises is concrete: How can one characterize extremely weak, noisy, and potentially condition-dependent recordings in a reproducible way?
Weak-signal measurement has long been a central challenge in biomedical engineering, especially when the target signal is small relative to environmental and instrumentation noise [2,3]. Frequency-domain and time-frequency tools remain standard choices for revealing latent structure in such data because they separate narrowband artifacts, transient responses, and broadband fluctuations more clearly than direct visual inspection in the sample domain [4–6]. Related work in liquid and tissue characterization also shows that frequencydependent responses can be informative when direct rawwaveform inspection is inconclusive [2,7]. At the same time, prior work adjacent to bioresonance and electronically transferred remedies remains controversial and methodologically heterogeneous, which makes transparent signal-processing protocols particularly important [8].
The goal of this paper is therefore intentionally modest and engineering-centered. Rather than validating the biological mechanism suggested by the source document, we reconstruct the device concept from that document, formalize the analysis logic implemented in the provided compare_bins.py script, and quantify how strongly the supplied recordings separate under several pairwise comparisons. We also use the present signal results to define a more defensible path for follow-up user studies, since subjective benefit claims are especially vulnerable to expectancy and placebo effects [9–11]. Our contributions are fourfold:
• A source-document-guided description of the measurement chain.
• A reproducible frequency-domain comparison pipeline for the provided 16-bit recordings.
• An empirical assessment of baseline drift, blank-to-sample separability, and within-class variability.
• A sham-controlled ten-participant feedback framework and preliminary anonymous, non-clinical feasibility summary designed to reduce expectancy and placebo confounds in future validation work.
Materials and Methods
System model
The source document describes three main functional blocks: A signal acquisition module, a signal processing module, and a signal output module [1]. In the acquisition stage, a sample carrier is placed inside a cavity near a first magnetic unit and a receiving element. The processing stage then filters and amplifies the captured weak signal, while the output stage retransmits the processed result through a coil and an output carrier. The design notes further mention optional components such as a second magnetic unit, a capacitor, and a power-supply unit.
Figure 1 shows an author-created high-level functional abstraction of the device architecture. From a measurement perspective, the system can be summarized as a weak-coupling sensing front-end followed by analog conditioning and carrierside retransmission. This structure motivates a data-analysis strategy that focuses on relative comparisons instead of absolute amplitudes.
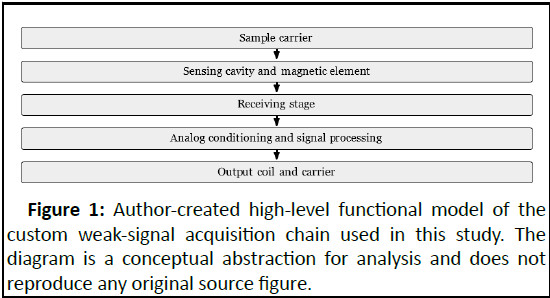
Figure 1: Author-created high-level functional model of the custom weak-signal acquisition chain used in this study. The diagram is a conceptual abstraction for analysis and does not reproduce any original source figure.
Materials and signal-processing pipeline
Dataset used in this study: The supplied dataset contains multiple binary recordings, including ambient-air runs, blankemulsion runs, two BPDE-labeled runs, and several additional exploratory files. To keep the paper focused on the bestdocumented pairings, we analyze the four comparisons listed in Table 1. Each binary file is 4,096,000 bytes, which corresponds to 2,048,000 unsigned 16-bit samples, or exactly 1000 nonoverlapping frames of length 2048.
| Comparison | Files | Purpose |
| Ambient baseline | Air A vs. air B | Setup sensitivity |
| Blank vs. sample A | Blank control vs. BPDE A | Class separation |
| Blank vs. sample B | Blank control vs. BPDE B | Repeatability check |
| Sample A vs. sample B | BPDE A vs. BPDE B | Within-class variation |
Table 1: Binary recordings used in this paper.
Scope, assumptions, and threats to validity: The available data support only an exploratory analysis, and several assumptions are required to make the comparisons interpretable. First, the principal conditions in this paper are represented by single recordings rather than by independently repeated acquisitions. The 1000 frames used in the spectral analysis therefore come from segmentation of one run per condition, not from 1000 independent experiments. Consequently, the reported Cohen’s d values quantify withinrecording separability across frames and should not be interpreted as inferential effect sizes for a broader population [12].
Second, the metadata are incomplete. The supplied scripts use a nominal sampling rate of 1 MHz for visualization, but this value is not independently verified for every file in the dataset. For that reason, the ambient-air comparison is discussed in kHz because it follows the script default, whereas the blank-to-BPDE comparisons are interpreted primarily in normalized frequency (cycles/sample), which is safer when acquisition-rate provenance is limited.
Third, the frequency bins emphasized later in the paper are selected descriptively from the observed spectra rather than through pre-registered hypothesis tests. No family-wise multiplicity correction is claimed, so the highlighted peaks should be interpreted as candidate follow-up markers rather than validated biomarkers. Fourth, the terms “before” and “after” in the plotting script denote pair ordering only; they do not imply temporal causality, intervention status, or treatment progression. Finally, because hardware geometry, shielding, distance, and acquisition order were not logged exhaustively, the manuscript cannot isolate whether observed differences arise from sample composition, instrument drift, environmental coupling, or a combination of these factors. These constraints are addressed explicitly in the interpretation of the results below.
Comparison method: The analysis pipeline follows the logic implemented in the provided compare_bins.py. Let r[n] denote the raw unsigned 16-bit sequence. A fixed bias of 2048 is removed:

The corrected sequence is then divided into non-overlapping frames of length L=2048:

For each frame, a Hann window w[n] is applied before a realvalued FFT:

where E=10−12 prevents numerical underflow.
Because absolute frame amplitudes vary strongly across recordings, the script normalizes each frame by subtracting its own median spectrum:

This step is crucial: It suppresses frame-wide gain changes and makes narrow band differences more visible in the heat maps.
For each comparison, the pipeline generates:
• Time-domain traces
• 2-D FFT heat maps of Aˆm[k];
• A robust median summary spectrum

• A difference spectrum

• A frame-wise difference heat map; and
• A per-bin Cohen’s d

where μi[k] and σi[k] are the mean and standard deviation across frames for condition i.
The plotting code also uses percentile-based visualization limits (1st to 99th percentiles), which reduces the influence of extreme bins when rendering heat maps. In reviewer terms, the method is best understood as a deterministic descriptiveanalysis pipeline rather than a statistical hypothesis-testing framework.
Proposed ten-participant blinded feasibility-feedback extension: Although the present manuscript is built around benchtop binary recordings rather than a prospective clinical efficacy trial, the device’s output-carrier concept ultimately requires user-level evaluation. For that stage, uncontrolled testimonials are not enough: Subjective benefit ratings can improve under expectancy and sham procedures even when objective effects do not separate cleanly [9–11]. For the ten participants currently available, the appropriate role of the observations is anonymous, non-clinical feasibility feedback. Any later efficacy-oriented work should use a randomized, shamcontrolled, two-period crossover pilot rather than an open-label demonstration or a simple before-versus-after design. Crossover reporting guidance also fits naturally here because each participant can serve as his or her own control [13].
In practical terms, each participant should complete one active-carrier session and one sham-carrier session in counterbalanced order, ideally five participants in an AB sequence and five in a BA sequence. A third party should label the two carriers anonymously so that the participant and the assessor remain masked to assignment, and the sham condition should preserve all contextual cues appearance, weight, handling, contact time, verbal script, room setup, and operator behavior while withholding the putative transferred signal. Recommended design elements are summarized in Table 2, and the participant-reported endpoints are listed in Table 3.
| Element | Recommendation |
| Participants | 10 pilot participants; each participant completes both conditions |
| Allocation | Counterbalanced AB/BA order; target 5 participants per sequence when feasible |
| Conditions | Active carrier versus sham carrier matched in appearance and handling |
| Blinding | Third-party code assignment; participant and assessor blinded to active/sham identity |
| Session timing | Baseline, fixed exposure, immediate post, and short follow-up ratings |
| Washout | At least 24–48 h between sessions to reduce carryover |
| Context control | Same room, script, device distance, grounding state, posture, and time-of-day window when possible |
| Primary endpoint | Pre-specified target symptom change on a 0–10 visual analogue scale |
| Secondary endpoints | Overall improvement, local sensation, relaxation, discomfort, and session guess |
Table 2: Recommended sham-controlled crossover design for the current ten-participant pilot.
| Measure | Scale | When | Purpose |
| Target symptom intensity | 0–10 vas | Pre, post, follow-up | Primary within-session outcome |
| Overall perceived change | −3 to +3 | Post, follow-up | Global improvement or worsening |
| Local sensation (warmth, tingling, pressure) | 0–10 each | Post | Describe perceived response without equating sensation with eï¬?icacy |
| Relaxation or mental clarity | 0–10 each | Pre, post | Exploratory secondary outcomes |
| Discomfort or adverse sensation | 0–10+ note | Post, follow-up | Tolerability and safety logging |
| Expected benefit before session | 0–10 | Pre | Quantify expectancy bias |
| Blinding guess | Active, sham, unknown | Post | Check masking success |
| Guess confidence | 0–10 | Post | Separate uncertainty from confident unblinding |
Table 3: Recommended participant-reported measures for the blinded pilot.
For each session, the primary endpoint should be prespecified as symptom improvement in one target score, for example

where larger positive values indicate greater symptom reduction. The primary paired contrast is Iactive-Isham. With only ten participants, reporting should emphasize paired raw values, median paired differences, exact sign counts, and Wilcoxon signed-rank results rather than asymptotic claims. Expectancy should be recorded before exposure, and blinding integrity should be checked after each session by asking participants to guess active, sham, or unknown. Those responses can then be summarized using simple counts and formal blinding indices such as the James and Bang indices [14,15]. Table 4 gives a compact reporting layout for the final human-feedback version of the manuscript.
| Endpoint | Participant-level quantity | Group summary |
| Primary symptom improvement | Iactive−Isham | median, IQR, paired plot, Wilcoxon p |
| Responder direction | Active better, sham better, tie | exact counts and sign test |
| Global perceived change | Active score minus sham score | median, IQR; exploratory only |
| Local sensation intensity | Active score minus sham score | descriptive median and range |
| Expectancy balance | Active expectation minus sham expectation | median, IQR before exposure |
| Blinding integrity | Guess and confidence after each session | counts; James/Bang index |
| Tolerability | Worst discomfort score per condition | Maximum, median, and notes |
Table 4: Planned reporting structure for ten-participant feasibility feedback.
Ethics
The binary signal recordings analyzed in this manuscript are benchtop/device recordings and did not involve identifiable human or animal subjects. The ten-participant eye drop-sample preference summary is reported only in aggregate form, without participant identifiers, and is treated as anonymous, non-clinical feasibility feedback rather than clinical efficacy validation.
Because this feedback is presented as anonymous feasibility feedback only, no claim is made that it represents a prospective clinical trial or validated therapeutic outcome study. If the target journal, local regulations, or an institutional review process classifies the feedback component as human-subjects research, ethics approval or waiver details should be supplied before formal submission. Any future prospective clinical efficacy study should obtain ethics-committee approval and documented informed consent before enrollment and should be conducted in accordance with the Declaration of Helsinki.
Statistics
All signal-processing outcomes in this manuscript are descriptive. The 1000 frames per recording were generated by segmentation of single binary files and were not treated as independent biological replicates. Spectral differences are summarized using robust median spectra, difference spectra, and within-recording Cohen’s d, with no claim of populationlevel inference.
For the ten-participant anonymous feasibility feedback summary, the manuscript reports count and proportions only. Because the pilot data are subjective, small, and not accompanied by complete expectancy scores, guess-confidence ratings, symptom-specific pre/post values, or objective ocular endpoints, no confirmatory hypothesis test or therapeutic efficacy estimate is claimed.
Results
Ambient-air comparison: Strong sensitivity to setup variation
Figure 2 compares ambient-air baseline A and baseline B. Even without assigning biological meaning to these recordings, the air-to-air experiment is useful because it reveals how sensitive the system is to environmental or placement changes. Both spectra contain clear vertical narrowband structures, especially below roughly 250 kHz, but the pattern strength and frame-wise organization differ markedly between the two measurements.
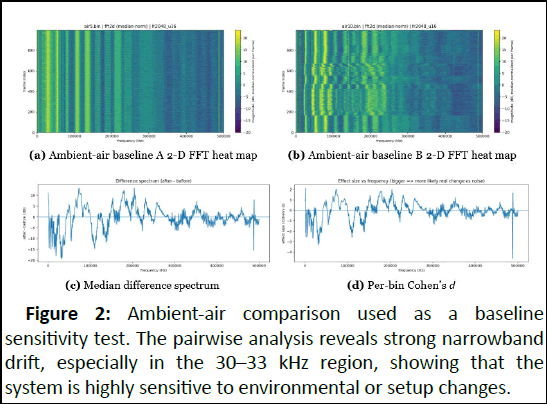
Figure 2: Ambient-air comparison used as a baseline sensitivity test. The pairwise analysis reveals strong narrowband drift, especially in the 30-33 kHz region, showing that the system is highly sensitive to environmental or setup changes.
The strongest changes occur near 30.27, 30.76, 31.25, 32.23, 32.71, and 33.20 kHz, where the median-spectrum shifts are around -18 to -19 dB. The effect-size plot reaches |d|>3 at some bins, far above the “large” range commonly used for descriptive interpretation [12]. This is not evidence of sample specificity; rather, it shows that the acquisition chain is highly responsive to environmental conditions, shielding, alignment, or other uncontrolled factors.
Table 5 summarizes the strongest descriptive differences across all four pairings. This table is included to make the crosscomparison logic explicit: The manuscript’s main claim does not rest on a single blank-versus-BPDE plot, but on the pattern that blank-to-BPDE comparisons are consistently stronger than BPDEsample- A-versus-BPDE-Sample-B separation.
| Participant-reported comparison | Count | Proportion | Interpretation |
| Subjectively brighter visual field plus less periocular dryness and tightness with the signal-conditioned sample | 3/10 | 30% | Two concurrent subjective sensations |
| Less periocular dryness and tightness only with the signal-conditioned sample | 4/10 | 40% | Periocular comfort sensation only |
| No clear difference between the two samples | 2/10 | 20% | Indistinguishable subjective response |
| Non-signal eye drop sample better than signal-conditioned sample | 1/10 | 10% | Control-favoring preference |
| Any active-favoring preference | 7/10 | 70% | Descriptive preference signal; not an e�icacy claim |
Table 5: Initial anonymous feasibility feedback for ten paired eye drop-sample comparisons.
Blank emulsion control vs. BPDE samples
The blank-emulsion comparisons are the most informative part of the provided dataset be-because they are less dominated by gross environmental drift and more consistent across repeated pairings. Figure 3 shows the comparison between blank-emulsion control and BPDE sample A. The median spectrum, the difference spectrum, and the effect-size curve all indicate structured deviations across multiple frequency bands rather than isolated single-bin spikes. Under a reviewer standard, the important point is not that a single comparison appears separated, but that the same frequency neighborhoods recur across two nominally different BPDE-labeled runs.
More importantly, these dominant bands are reproduced when blank-emulsion control is compared with BPDE sample B. Table 6 lists the most repeatable frequencies across the two blank-to-BPDE comparisons. The strongest common peaks appear near normalized frequencies 0.0952, 0.1187, 0.1665, 0.2378, 0.3335, and 0.4893 cycles/sample. For these bins, the blank-to-BPDE shifts are typically 6–8 dB and the corresponding effect sizes are close to or above d=1.0, which is large on a descriptive scale [12]. The consistency of these bins across both BPDE recordings is more encouraging than any single comparison alone.
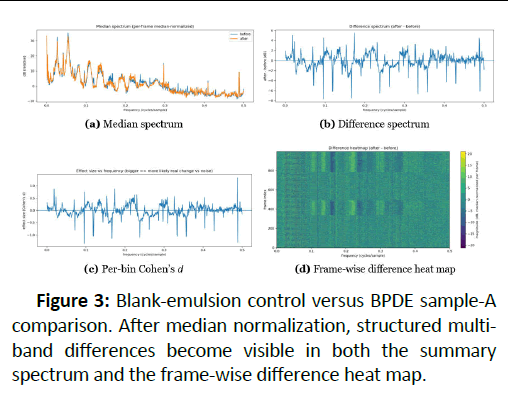
Figure 3: Blank-emulsion control versus BPDE sample-A comparison. After median normalization, structured multiband differences become visible in both the summary spectrum and the frame-wise difference heat map.
| Pair | Freq. | Max | Max |d| | Main interpretation |
| Baseline A vs. baseline B | kHz | 19.19 dB | 4.62 | Baseline strongly setup-dependent |
| Blank control vs. sample A | norm. | 7.62 dB | 1.35 | Clear frame separation |
| Blank control vs. sample B | norm. | 7.50 dB | 1.45 | Pattern replicated |
| Sample A vs. sample B | norm. | 2.18 dB | 0.50 | Weak within-class separation |
Table 6: Reviewer-oriented summary of pairwise descriptive outcomes.
BPDE sample A vs. sample B: within-class separability remains limited
The comparison between BPDE sample A and BPDE sample B is much weaker. The maximum difference reported by the same pipeline is approximately +2.18 dB at 0.1582 cycles/sample, and the corresponding effect size at that bin is only d=0.23. Across the full spectrum, the peak absolute effect size is about 0.50, which is still small compared with the blank-to-BPDE comparisons. In other words, the pipeline clearly separates blank emulsion from BPDE-labeled samples, but it does not yet produce strong separation between the two BPDE recordings themselves.
This finding is important because it keeps the interpretation honest. The provided recordings support a sample-class perturbation claim more strongly than a dose- or state-resolved discrimination claim. For an exploratory medical instrumentation manuscript, that is still a useful result: It identifies where the present instrumentation appears informative and where it remains underpowered.
Initial ten-participant anonymous feasibility feedback
An initial anonymous feasibility-feedback summary was also available for ten paired eye drop-sample comparisons. Participants compared a signal-conditioned eye drop sample with a non-signal sample and reported their subjective sensations. As summarized in Table 5, 3 participants reported that their visual field felt brighter and that the periocular area felt less dry and tight with the signal-conditioned sample; 4 reported only less periocular dryness and tightness; 2 could not distinguish a clear difference; and 1 reported that the non-signal sample felt better. Thus, 7 of 10 participants expressed an active-favoring preference.
This result is useful as anonymous, non-clinical feasibility and acceptability feedback, but it should not be interpreted as proof of medical efficacy. The response categories are subjective, the sample size is small, and full expectancy scores, guess confidence, symptom-specific pre/post ratings, and objective ocular endpoints were not yet available for inferential analysis. The main value of the result is that it supports continuing with a stricter crossover protocol rather than relying on open-label impressions alone.
Discussion
Several lessons follow from the experiments above
First, the document-informed sensing chain appears highly sensitive to weak condition changes, but the air comparison shows that uncontrolled environmental variation can be as large as, or larger than, the effects of interest. This makes randomized acquisition order, shielding, grounding control, distance control, and repeated day-to-day measurements essential. A reviewer would reasonably ask for these controls before accepting any stronger claim about sample specificity.
Second, the most reliable structure in the current dataset is not in the raw sample domain but in the normalized frequency domain. This justifies the choice made in compare_bins.py: Perframe median normalization, robust median spectra, and effectsize curves are more informative than direct waveform inspection for these recordings.
Third, the consistency between the blank-to-sample-A and blank-to-sample-B comparisons suggests that the observed multi-band pattern is not a pure plotting artifact. The repeated frequency bins in Table 7 could serve as candidate markers for future verification studies. However, because the sample-A-to- Sample-B separation remains small, the present dataset does not justify strong claims about concentration quantification or fine-grained sample ranking.
| f | Blank → sample A | Blank → sample B | ||
| (dB) | d | (dB) | d | |
| 0.0952 | 7.62 | 1.35 | 7.50 | 1.29 |
| 0.1187 | 6.14 | 1.02 | 5.93 | 0.95 |
| 0.1665 | 7.49 | 1.14 | 6.86 | 1.01 |
| 0.2378 | 6.54 | 1.10 | 5.91 | 0.99 |
| 0.3335 | 6.68 | 1.06 | 6.01 | 1.02 |
| 0.4893 | 6.10 | 1.31 | 5.72 | 1.31 |
Table 7: Most repeatable blank-to-BPDE frequency bins (normalized frequency in cycles/sample).
Fourth, if this line of work is extended from sample-level separability to participant-level benefit claims, then placebo control becomes a central design requirement rather than a cosmetic extra. Subjective ratings can improve under sham interventions and other contextual cues [9,10], so the tenparticipant extension proposed in prioritizes masked activeversus- sham comparisons, expectancy logging, and explicit blinding checks over open-label impressions alone. The initial 7- of-10 active-favoring eye drop preference pattern is encouraging, but because one participant favored the non-signal sample and two reported no clear difference, the observation is best treated as anonymous feasibility feedback rather than confirmatory evidence.
Finally, the current study has several limitations. Only pairwise comparisons were avail-able, the acquisition metadata are incomplete, the nominal sampling rate is not fully validated for every file, no blind labels were provided for the binary recordings, and the statistical outputs are descriptive rather than inferential. Most importantly, segmentation of one recording into many frames does not replace biological or experimental replication. The ten-participant feedback summary is also only anonymous, non-clinical feasibility feedback, suitable for bias reduction and protocol refinement but not for strong efficacy claims. Future work should add sham carriers, independent hardware references, repeated acquisitions under controlled geometry, acquisition logs, pre-registered analysis rules, complete expectancy and blinding-confidence forms, symptomspecific pre/post scoring, and supervised classification with proper train/test separation across independently repeated runs.
Conclusion
This paper converted a device concept from a supplied design document and a collection of exploratory binary recordings into a reproducible journal-style signal-analysis study. Using the provided compare_bins.py logic, we showed that:
• The system is highly sensitive to environmental variation.
• Blank emulsion and BPDE-labeled recordings exhibit repeatable multi-band spectral differences.
• Within-class separation between BPDE sample A and sample B is still limited.
• Anonymous, non-clinical feasibility feedback from ten participants showed that 7 of 10 participants favored the signal-conditioned eye drop sample over the non-signal sample.
The main value of the work is therefore methodological rather than confirmatory: It provides a transparent analysis baseline, a more self-critical interpretation framework, and a defensible roadmap for stricter blinded follow-up studies.
Funding
No external funding was reported.
Data Availability
The binary recordings and analysis scripts used for the signalprocessing component are available from the corresponding author upon reasonable request, subject to privacy, sourcedocument, and submission restrictions.
Conflict of Interest
Jui-Hung Lu is affiliated with PowerHealth Rehabilitation and Integrative Medicine Clinic. Hung-Chiang Cheng is affiliated with China Medical University and I-Shou University. No additional competing interests were reported.
References
- Supplied Design Document. Signal acquisition and conversion device design notes. Privately supplied technical document, 2020. Source document supplied by the author.
- Bera TK (2014) Bioelectrical impedance methods for noninvasive health monitoring: A review. J Med Eng 2014:381251
[Crossref] [Google Scholar] [PubMed]
- Boto E, Holmes N, Leggett J, Roberts G, Shah V, et al. (2018) Moving magnetoencephalography towards real-world applications with a wearable system. Nature 555:657-661
[Crossref] [Google Scholar] [PubMed]
- Welch P (1967) The use of fast Fourier transform for the estimation of power spectra: A method based on time averaging over short, modified periodograms. IEEE Transactions on Audio and Electroacoustics 15:70-73.
- Addison PS (2005) Wavelet transforms and the ECG: A review. Physiol Meas 26:R155-R199
- Sun M, Scheuer ML, Sclabassi RJ (2000) Decomposition of biomedical signals for enhancement of their time–frequency distributions. J Frankl Inst 337:453-467
- Klyve D, Anderson Jr JH, Lorentz G, Somers VK (2023) Detecting unique analyte-specific radio frequency spectral responses in liquid solutions-Implications for non-invasive physiologic monitoring. Sensors 23:4817
[Crossref] [Google Scholar] [PubMed]
- Liu LL, Wan KS, Cheng CF, Tsai MH, Wu YL, et al. (2013) Effectiveness of MORA electronic homeopathic copies of remedies for allergic rhinitis: A short-term, randomized, placebo-controlled pilot study. Eur J Integr Med 5:119-125
- Hróbjartsson A, Gotzsche PC (2001) Is the placebo powerless? An analysis of clinical trials comparing placebo with no treatment. N Engl J Med 344:1594-1602
[Crossref] [Google Scholar] [PubMed]
- Wechsler ME, Kelley JM, Boyd IO, Dutile S, Marigowda G, et al. (2011) Active albuterol or placebo, sham acupuncture, or no intervention in asthma. N Engl J Med 365:119-126
[Crossref] [Google Scholar] [PubMed]
- Kaptchuk TJ, Miller FG (2015) Placebo effects in medicine. N Engl J Med 373:8-9
[Crossref] [Google Scholar] [PubMed]
- Lakens D (2013) Calculating and reporting effect sizes to facilitate cumulative science: A practical primer for t-tests and ANOVAs. Front Psychol 4:863
[Crossref] [Google Scholar] [PubMed]
- Dwan K, Li T, Altman DG, Elbourne D (2019) CONSORT 2010 statement: Extension to randomised crossover trials. BMJ 366
[Crossref] [Google Scholar] [PubMed]
- James KE, Bloch DA, Lee KK, Kraemer HC, Fuller RK (1996) An index for assessing blindness in a multiâ?ÂÂÃÂcentre clinical trial: Disulfiram for alcohol cessation—a VA cooperative study. Stat Med 15:1421-1434
[Crossref] [Google Scholar] [PubMed]
- Bang H, Ni L, Davis CE (2004) Assessment of blinding in clinical trials. Control Clin Trials 25:143-156
[Crossref] [Google Scholar] [PubMed]

Open Access Journals
- Aquaculture & Veterinary Science
- Chemistry & Chemical Sciences
- Clinical Sciences
- Engineering
- General Science
- Genetics & Molecular Biology
- Health Care & Nursing
- Immunology & Microbiology
- Materials Science
- Mathematics & Physics
- Medical Sciences
- Neurology & Psychiatry
- Oncology & Cancer Science
- Pharmaceutical Sciences