Quality Assurance of Dynamic Multi-Leaf Collimators (MLC)
Alemayehu Debbo Telila*
Department of Medical Physics, Hawassa University Comprehensive and Specialized Hospital, Oncology Center, Hawassa, Ethiopia
Published Date: 2025-02-28DOI10.36648/2574-285X.10.1.88
Alemayehu Debbo Telila*
Department of Medical Physics, Hawassa University Comprehensive and Specialized Hospital, Oncology Center, Hawassa, Ethiopia
- *Corresponding Author:
- Alemayehu Debbo Telila
Department of Medical Physics, Hawassa University Comprehensive and Specialized Hospital, Oncology Center, Hawassa, Ethiopia
E-mail:alexdebbo.7@gmail.com
Received date: November 15, 2023, Manuscript No. IPIMP-23-18129; Editor assigned date: November 17, 2023, PreQC No. IPIMP-23-18129 (PQ); Reviewed date: December 01, 2023, QC No. IPIMP-23-18129; Revised date: March 13, 2025, Manuscript No. IPIMP-23-18129 (R); Published date: March 20, 2025, DOI: 10.36648/2574-285X.10.1.88
Citation: Telila AD (2025) Quality Assurance of Dynamic Multi-Leaf Collimators (MLC). J Med Phys Appl Sci Vol:10 No:1
Abstract
The purpose of this study was to provide a list of critical performance tests used in establishing and maintaining a safe and effective QAP of Dynamic Multi Leaf Collimators (DMLC). Positional accuracy of MLC was assessed by using EPID based Picket Fence test. Pylinac v3.0 and Dynalog File Viewer (DFV) were used for evaluation of leaf position error. To assess accurate control of leaf speed ImageJ software was used. PTW30013 Farmer type chamber with sensitive volume of 0.6 cm3 was used in water phantom fixed at a depth of 10 cm for 6 MV and 15 MV photon energies to measure leaf transmission. The DLG values were measured using DICOM QA plan files applying the sweeping gap technique. The average and maximum MLC positional error was below AAPM TG-142 tolerance limit (1 mm). The range of values of ROI deviation (0.13-1.4%) and the average of the absolute value of all the ROI deviations (0.7%) for the four dose strips were well within the tolerance values indicated by references and varian provided recommendations for the rapid arc QA. The result of leaf transmission factor from the current study for 6 MV and 15 MV are within the limit of AAPM TG-50 report. The DLGs obtained were 1.42 mm and 1.59 mm at 6 MV and 15 MV respectively, which are comparable with similar studies. EPPID based PF analysis using Pylinac and Dynalog File Viewer are fine and comparable to analyze the MLC positional errors as required by the AAPM TG-142 report for MLC QA and a tighter action criterion of ± 0.5 mm for MLC position error for RapidArc is proposed. MLC speed accuracy could be evaluated using ImageJ and manufacturer provided DICOM QA plan. These concepts and findings have broad implications for VMAT treatments with DMLC and the procedures are applicable to other MLC designs as well.
Keywords
DFV; MLC; Leaf transmission; ROI deviation
Introduction
The evolution of radiotherapy techniques, during recent years, led to the delivery of more complex dose patterns, based either on the dose conformation to the target volume and on the modulation of the delivered beam intensity. Dynamic Multi Leaf Collimator (DMLC) technology has been widely used in IMRT and Volumetric Modulated Arc Therapy (VMAT), given its better tumour dose conformity and reduced radiation to the organs at risk [1,2]. The accuracy of Dynamic Multi Leaf Collimator (DMLC) positions is one of the factors that most greatly influence the resultant precision in dose delivery [3].
A comprehensive quality management program in External Beam Radiation Therapy (EBRT) includes performance testing of a LINAC. The tests should be selected to fit the clinical patterns of use of the accelerator and care should be given to perform tests which are relevant to detect errors related to the specific use of the LINAC [4].
Several methods for Quality Assurance (QA) of MLC in VMAT have been proposed in the literature. MLC errors can be inferred from dose deviations on film, EPID and Ionization chambers [5,6]. The garden fence test is traditionally used to verify the actual versus planned MLC stop position [7]. Although this method is generally performed with radiographic film, it is timeconsuming, and analysis is costly. The same tests have recently been performed with Electronic Portal Image Devices (EPIDs) by Yang, et al. [8]. Log files that are created each time a dynamic delivery occurs, can also be used to evaluate leaf positions and the utility of the Dynalog files for routine IMRT QA was studied [9]. The Dynamic MLC log files for IMRT QA using a 2D diode arrays was validated by [10]. Accurate control of the MLC speed has a major impact on the delivered dose to the patient since errors in leaf speed can result in increased beam holds or gap width error during dynamic delivery. The dosimetric effects of leaf speed errors were reported by Huang, et al. and an acceptance quantitative criterion has been proposed for MLC leaf position and speed in AAPM Task Group report 142 [11,12].
The rounded leaf transmission has more significance in treatments using DMLC than in those using static MLC delivery technique. DMLC treatments tend to amplify the importance of the transmitted photons and the MLC transmission factors are used in the calculation of the relative dose distribution to correct for primary transmission through MLC.
We need to measure transmission of the MLC, First, when it is necessary to organize and carryout a series of acceptance tests for a new accelerator with MLC. Second, additional commissioning measurements are needed to model the MLC for treatment planning, where it was the objective in in this study. Third, a routine quality assurance program must be established to determine continued reliable operation of the entire MLC system. Unlike treatment with static fields using a multi leaf collimator, collimator transmission and the transmission through the rounded leaf ends are among the significant dosimetric characteristics which must be assessed before dynamic therapy can be implemented. If not accounted for, these factors affect substantially the delivered dose to prostate by 5%-20% for a typical plan [13].
Dosimetric Leaf Gap (DLG) is a parameter to model the roundleaf- end effect of MLC that is important for TPS dose calculations in radiotherapy accounting for the partial transmission through the rounded ends of MLC. When radiation passes through the rounded leaf end, the transmission affects the radiation field edge. In the TPS, this effect is compensated by shifting the leaf tip position by half the value of the DLG when calculating the fluence [14]. The complex high precession technique, such as IMRT, entails the modelling of optimum value of DLG inside eclipses TPS for precise dose calculation. To maximize the benefits of rapid arc approach which requires the synchronization of the dose rate with other dynamic components of the machine, both the TPS and LINAC systems incorporate the following capabilities: Dynamic MLC movement, variable dose rate, and variable gantry speed, with the expectation that these will optimize dose conformation, delivery efficiency, accuracy, and reliability.
Even if there is patient specific quality assurance program in the radiotherapy department of AOUP, measurements of the accuracy of MLC leaf position and leaf speed, accuracy of dose rate and gantry speed during rapid arc delivery has not been quantitatively investigated and only patient specific QA may not test the full range of MLC position, MLC leaf speed, dose rate, and gantry speed which are varied throughout the treatment during dynamic delivery. Therefore, monthly test of each of the dynamic control components used clinically is recommended.
The transmissions through the leaves and leaf ends during rapid arc delivery contribute to the dose throughout the target, not just near or outside the field boundary as for static MLC fields. The purpose of this study is therefore to provide a list of critical performance tests to assist Qualified Medical Physicists in establishing and maintaining a safe and effective Quality Assurance (QA) program of MLC for rapid arc delivery at AOUP.
Materials and Methods
Varian Clinac DHX linear accelerator
The delivery system for all the measurements in this study was Varian Clinac DHX linear accelerator with Millennium 120 leaves, 6 MV and 15 MV photon beam energies with Portal Vision aS500 panel and CBCT imaging capabilities.
Millennium 120 Multi-Leaf Collimator (DMLC) description
Varian Clinac MLC 120 leaf design consists of two banks of MLCs, each comprising 60 Tungsten alloys of leaves, approximately 6 cm of height each of which the central 40 are 5 mm wide and the outer 20 are 10 mm wide (at iso-centre). The MLC collimator is mounted on CLINAC DHX linear accelerator as a tertiary collimator configuration below the conventional jaw collimators with the centre of leaf bottom positioned at 53.8 cm from the source. The leaves, mounted with in carriages, move in a rectilinear fashion, in the same direction as the lower jaw collimators. The leaves in the Varian collimator travel on a carriage that serves to extend their movement across the field. However, the distance between the most extended leaf and the most retracted leaf on the same side can only be 14.5 cm (i.e., the leaves can travel up to 14.5 cm maximum relative to the carriage) at iso-center relative to the carriage. The ends of the leaves are rounded to ensure a relatively constant penumbra, at different positions in the beam. The maximum leaf speed is 2.5 cm/sec at iso-center. The central 3 cm portion of each leaf end is circular with a radius of curvature of 8 cm, where beyond this the leaf end is straight, and at an angle of 11.30 relative to the vertical axis. Leakage between adjacent leaves is minimized by an interlocking tongue and groove arrangement. The rectilinear leaf motion and the rounded leaf edge, in combination, introduce a nonlinear dependence of leaf position on field size. The ‘’sliding window’’ technique, where all leaves start at one end of the field and move uni-directionally, with different speeds, to the other end, is used to deliver the intensity modulated profiles.
Characteristics of portal vision aS500
A Varian electronic portal imaging device, aS500 which is based on amorphous Silcon technology was used to acquire portal images in this study. The Image Detection Unit (IDU) of the Portal Vision aS500 is connected by a cable to the therapy control area from where image acquisition, processing and display are controlled. Within the detector a scintillator converts the incoming X-rays to visible photons. The light is sensed by an array of photodiodes, which are implanted on the amorphous silicon panel. The photodiodes integrate the incoming light in charge captures. The sensitive area of the panel is 40 × 30 cm2. The resolution of 512 × 384 pixels with reference to the active image area yields a spatial resolution of 0.784 mm. The detector electronics allows transferring the charges from the pixels to the read-out electronics, by activating row after row of the pixel matrix while all the columns (Data lines) are read-out thus forming an image of almost 200,000 pixels.
The a-Si detector has a metal plate for physical build up (to remove low energy photons), followed by a phosphor plate to transform incoming X-rays to visible photons, and then the pixel array implanted on the a-Si plate to capture visible photons and convert them to electric charges. Every pixel on the a-Si panel basically consists of a light sensitive photodiode and a Thin Film Transistor (TFT). The photodiode acts like a capacitor since the received light is integrated and captured as an electric charge. By enabling the gate line, the TFT is switched transparent, and the charge kept in the photodiode is read out over the data line. Source to Image Distance (SID) is kept between 100 cm and 180 cm.
Techniques for acquiring the PF images
A slit field of 1 mm wide by 20 cm height was made and the field centre was kept at intervals of 1.5 cm. Irradiation with 100 MU was continuously done 10 times with no extension or retraction of EPID to detect MLC position-9 error. All PF images were acquired at SID of 100 cm using a 6 MV photon beam. As analysis of PF among the possible techniques (scan modes) of PF pattern acquisition available, the ones that have been used in this study were the integrated. With the integrated acquisition technique, the signal is accumulated for the whole duration of the exposure and subsequently read, producing an image consisting of a single frame. Before acquiring the images, it was necessary to acquire two sets of images, setting the acquisition parameters identical to that will be used when the accelerator will be used for treatments, calibration of the system: Dark field and flood field. In particular, the first is carried out daily and the second after maintenance on the LINAC. The Flood Field (FF) image corrects variations in sensitivity from pixel by pixel and removes in EPID images the characteristic ‘’horns’’ shape that presents in the profile of fields larger than 15 × 15 cm2.
Pre-requisites for rapid arc QA
As a pre-requisite for Rapid Arc QA, EPID calibration was designed for integrated imaging acquisition technique for 6 MV and at dose rate of 100 to 600 MU/min to remove background noise and provide a spatially uniform response for clinical image. The imager was positioned so that the lateral and longitudinal positions are equal to 0 during imaging at SID of 100 cm. The LINAC was calibrated at both 6 MV and 15 MV before EPID image acquisition to maintain the quality of the data to be collected. Daily output constancy check of photon beams was implemented during the period of data collection using PTW Quick Check device and it was particularly checked that there was no sudden variation in the dose output resulting in greater or lower than 1.5% deviation from calibration. In addition, measurement of output of the LINAC at gantry angles 00, 900, 1800, 2700, was performed for 4 × 10 cm DMLC field with a 0.5 cm slit at the four cardinal gantry angles to test the effect of gravity on gantry head/dosimetry system and MLC position. Mean pixel values were calculated for each DMLC field at each gantry angle using imageJ, and normalized to the corresponding open field (4 × 10 cm2) pixel values to account for the influence of field flatness and asymmetry. The deviation of each ROI, and the average of all deviation values (Reference value) were evaluated using the following formulas.
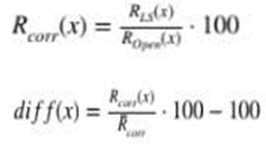
Where,
Rcorr (x)=Is normalized mean pixel value,
Diff (x)=Is the deviation of each normalized mean pixel value from the average (Reference value)
Effect of gravity on MLC positional accuracy
To detect any gravity induced positional errors on MLC, EPID based Picket Fence patterns of MLC leaf pairs sweep across the field, irradiating a 1 mm gap every 15 mm from the static DICOM plan QA files, was acquired at 0°, 180°, 90°, and 270° gantry angles and average leaf positional error was compared [15]. The standard deviation in average median positional errors was evaluated for each PF acquisition at each gantry angle using Pylinac v3.0 software. In addition, superimposed line profiles at the pickets along the internal leaf pairs for the four gantry angles were compared. The picket fence module is meant for analysing EPID images where a “picket fence” MLC pattern has been made. It can load in an EPID DICOM image (or superimpose multiple images) and determine the MLC peaks, error of each MLC pair to the picket, and give a few visual indicators for passing, warning or failing.
Accuracy of DMLC position during rapid arc delivery
The Picket Fence leaf pattern introduced by Chui, et al. and Varian procedures was used in this study to verify if MLC positioning accuracy is within the set tolerance level (0.5 mm) and the one recommended by AAPM TG-142 protocol (1 mm) [16]. To assess the characteristics of MLCs during rapid arc delivery, a rotational gantry version (rapid arc) of the test pattern ‘’Picket Fence test’’, EPID based Rapid arc QA DICOM plans provided by Varian Medical Systems were used.
EPID images of the MLC leaf pairs sweeping across the field, irradiating a 1 mm gap every 1.5 cm, were collected using a Varian aS500 EPID (Varian Medical Systems, Palo Alto, CA) which was operated in integrated acquisition mode. All EPID measurements were acquired “in-air” with the calibrated aS500 Portal Vision MV imager using integrated image mode (i.e., without the presence of a patient or Phantom) with only the MLC leaves in motion with offset correction, gain correction, and pixel correction applied for each PF image. The Source to Detector Distance (SDD) was 100 cm, which improves the spatial resolution of the images. Individual image frames were collected at a rate of 8.42 frames per second (fps). The X and Y jaws were used to collimate the beam to the sensitive area of the detector. This study focused on the 40 inner leaves, as the outer leaves are not used in most of the dynamic treatments.
Evaluation of MLC positional error from EPID based Picket Fence (PF) test
The error in leaf position for each central 40 pairs of MLC leaf from the PF pattern was evaluated using open source Pylinac software. An ‘‘MLC position’’ is for Pylinac’s purpose, the center of the FWHM of the peak formed by one MLC pair at one picket. The PF algorithm uses expected lateral positions of the MLCs and samples those regions for the center of FWHM to determine the MLC position. Pylinac provides TG-142 Quality Assurance (QA) tools, contains high-level modules for automatically analysing images and data generated by linear accelerators. Pylinac presents the analysed image in such a way that allows for quick assessment of the percentage of leaf pairs position within the set tolerance (0.5 mm), average error, and the maximum positional error. The Pylinac accounts for panel translation, and panel sags (i.e., if panel is translated EPID knows and if the EPID sags at certain angles during image acquisition, just tell pylinac and the results will be shifted). Because Pylinac assumes a perfect panel, sometimes the analysis will not be centered exactly on the MLC leaves. If we want to correct for this, simply pass the EPID sag in mm. Dead pixels can cause wild values in otherwise well-behaved image. These values can disrupt analysis, but Pylinac will try to detect the presence of Noise and apply median filter if detected. Since the last picket was close to the edge, to avoid possibility of including columns of dead pixels, to clean it up from all edges crop of 3 mm was applied. To avoid tongue and groove influence on analysis, leaf analysis width ratio of 0.5 was applied as part of evaluation, where the center of half of the leaf will be used.
Dynamic log files and generating dynalog files
A dynamic MLC log file is a record of DMLC delivery details at every 0.05 s by the MLC controller for a dynamic treatment. The controller assigns unique file name to the generated Dynalog files and separate files are created for both MLC banks. Dynamic Dynalog files created by MLC controller were analyzed using Dynalog File Viewer (DFV) software. Dynalog File Viewer (DFV) is a utility program that analyzes data in Dynalog files and displays the data in graphical formats. It is used to statistically evaluate leaf position error and beam state of the linac during a dynamic treatment using a millennium MLC 120 leaf. This file gives the information about the planned versus actual leaf position for all leaves and provides error RMS (Root-Mean-Square) for individual leaf deviation and error histogram for all leaf deviation. Results of leaf positional accuracy from Pylinac were compared with the route mean square errors in leaf positioning obtained by analysis of Dynalog files generated by the MLC controller of the LINAC for the QA test files.
Error histogram
Error histogram shows information for all leaf deviations and creates a histogram with a tally of several leaf position deviations within each bin. The plot is broken in to 0.05 cm bins spanning a total range from 0-1 cm. The plot has a zerodeviation bin for deviations less than 0.005 cm and an above maximum bin for deviations greater than 1 cm. The error histogram bin boundaries represent position deviations at the iso-center plane.
If the sum of the percentages reaches 95% within the first 8 rows, the percent and percent sum columns of the row that crosses the 95% threshold, as well as the previous rows, are shaded green. If the sum of the percentages does not reach 95% in the first 8 rows, then the first 8 rows are shaded green, and the subsequent rows are shaded red up to the row that reaches the 95% mark. If there is non-zero # of counts value for bin 22, then that value is shaded yellow. The specifications that determine pass or fail (red or green) are set to match the current Varian specification and cannot be altered by the user.
Error RMS for leaf positioning using DFV
Error RMS shows the calculated RMS value for leaf deviations. DFV calculates the RMS for leaf position deviations of individual leaves using the following formula:
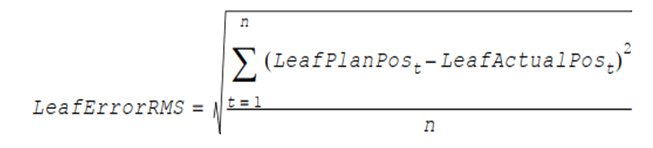
Where,
t=Data sample index
n= Total no. of samples
By selecting error RMS from the view menu of DFV, it is possible to display both the error RMS data and the error RMS plot. The first raw of the error RMS data table shows the average RMS error for the moving leaves on carriage A and carriage B.
The second row shows the maximum of the RMS error for the leaves on carriage A and carriage B. The green shading indicates the maximum of the two. If the RMS maximum value is greater than the acceptance specification, then the value is shaded red instead of green. The remaining rows represent the RMS error for each individual leaf. All error values are in units of cm at the treatment plane. Leaf pairs that do not move during the treatment are not included in the RMS calculations.
Ability to accurately vary Dose Rate and Gantry Speed (DRGS test)
Accurate control of gantry angle, gantry speed, and dose rate is necessary for accurate dose delivery. To assure that the LINAC accurately vary dose rate and gantry speed during rapid arc, EPID images of 7 bands (dose strips) of rapid arc MLCQA plans were given the same Monitor Unit (48 MU), which delivers the same dose to the seven strips with different combinations of dose rate, gantry range and gantry speed with a 1 mm gap between the strip, resulting in uniform intensity across the EPID image except for the gaps between the strips. It is possible to deliver equal doses per sector in two ways, high gantry speedhigh dose rate, low gantry speed-low dose rate, where the LINAC will always autonomously determine the gantry speed, dose rate and MLC leaf speed. Each VMAT plan consists corresponding seven adjacent dose strips of a 20 × 2 cm2 open fields. For specific dose delivery per gantry angle the gantry angle speed and dose rate are related by;
GS=DR/(MU/deg)
The seven static MLC fields of 2 × 20 cm2 were spaced 3 cm apart and irradiated during gantry rotation. Normalization is needed to remove the influence of non-flatness/asymmetry of the radiation field in the comparison of the exposures of the 7 strips.
Using imageJ, the horizontal and vertical ROI position for each band was specified. Scale was set for measurement and the horizontal ROI positions used were 138.5, 158.5, 178.5, 198.5, 218.5 and 258.5 mm with 100 mm vertical ROI position for all the 7 bands. The RapidArc field mean pixel values were then calculated, normalized to the open field (14 × 20 cm2) pixel values to account for the influence of field flatness and asymmetry) for the same over all field size, the deviation of each ROI, and the average of the absolute value of all diff (x) values were evaluated using the following formulas (Equations 1-3).
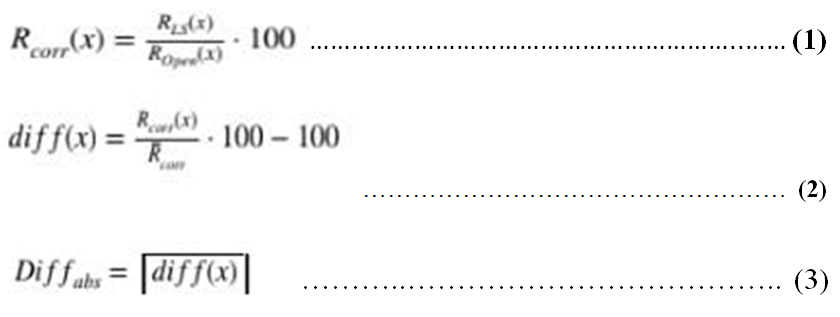
Where,
Rcorr(x) is the normalized Mean pixel value for a given RapidArc measurement ROI
RLS(x) is the Mean pixel value for the same ROI
Ropen(x) is the Mean pixel value at the same ROI in the open field
Rcorr is the average of Rcorr(x) for all seven strips.
Diffabs=average of absolute value of all diff (x)
Machines using these plans will typically achieve numbers below 1.5% for Diff abs.
Measurement and analysis of MLC leaf speed accuracy
In assessing accurate control of leaf speed during rapid arc delivery, four combinations of leaf speed and dose rate were used to give equal dose for four strips in a rapid arc field by using the DICOM MLC speed QA plan file. To allow delivery of the test on the clinical system, the arrangement of the leaf speeds was 0.4 cm/s, 0.8 cm/s, 1.4 cm/s and 2 cm/s with respective dose rates of 120, 240, 411.4, and 600 MU/min. By using record and verify system, the portal image was added by selecting integrated template, the beam was delivered following the procedure provided by Varian. In this test, the MLC speed is varied against the dose rate control for the four bands to give the same monitor unit to the MLC speed test DICOM plan. A non-uniform dose delivery indicates a problem with the dynamic control. Horizontal ROI positions for the four bands used for MLC speed test during rapid arc delivery were 153 mm, 183 mm, 213 mm and 243 mm all with vertical position of 100 mm. Open field mean pixel values were recorded at the same ROI position as the test image. The rapid arc field mean pixel values were then calculated, normalized to the open field pixel values (to account for the influence of field flatness and asymmetry) for the same over all field size, the deviation of each ROI, and the average of the absolute value of all deviations were evaluated. References and manufacturer recommendations indicate that the dynamic fields can deliver a dose within 3% of an open beam with the same dose objective [17].
MLC Transmission Factor (LTF)
The MLC transmission factor is the ratio of meter reading obtained for the blocked MLC field to the meter reading obtained for the open field collimator settings at a given depth in a phantom. LTF is an important systematic parameter used to model the rounded MLC leaf ends effect when commissioning an Eclipse Treatment Planning System (TPS). PTW30013 Farmer chamber with sensitive volume 0.6 cm3, was placed in a water phantom fixed at iso-centre at a depth of 10 cm, with field sizes of 10 × 10 cm2 and 10 × 30 cm2. First, the monitor response for the open field was recorded at each energy. The applied voltage was 400 V to the electrometer and the readings were taken for 6 MV and 15 MV photon beam. Separate measurement of the leaf transmission factor with the MLC leaves from each bank fully closed was done, and the average of the transmission from each bank was taken. During the measurement for the LTF, the ionization chamber and MLC leaves were positioned so that they are exposed to as little leakage between the MLC leaves as possible. For the resulting transmission factor, the following equation was used.
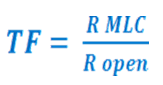
Where,
Ropen=Ionization chamber reading for the open field
RMLC=Ionization chamber reading for the MLC
Deriving DLG with sweeping gap technique
The method used was the sliding MLC gap plan provided by Varian medical systems with gap widths of 2, 4, 6, 10, 14, 16, and 20 mm using a Farmer Chamber type (PTW 30013), with sensitive volume of 0.6 cm3 in a water phantom and in the direction perpendicular to the leaf motion. Source to Surface Distance (SSD) was kept 90 cm and the chamber at 10 cm depth, where there is no possibility of electron contamination at this depth. The DLG values were calculated following the methodology described by LoSasso, et al., using an ion chamber and the Varian supplied DICOM files for the sweeping gap measurements. Open field of 10 cm × 30 cm was used for detector alignment and warm up. Then, transmission readings for MLC Bank A and MLC Bank B were measured. The gap moved from −60 mm to +60 mm with constant speed with respect to Monitor Unit (MU).
The meter readings for every gap were noted, and the corrected gap reading was calculated using transmission for the leaves. A graph was drawn with gap along the Y-axis and corrected gap reading along the X-axis. The integral ionizations were measured for nominal gap widths of 2, 4, 6, 10, 14, 16 and 20 mm, respectively. To accumulate the ionization contributed only by the sweeping gap field, the MLC transmission reading during the slit movement should be subtracted, as the chamber was totally shielded by the leaves. Finally, a linear regression analysis was applied with the Rg′ plotted against the nominal gap width, and the absolute intercept value of the fitted function provides a DLG result.
The RgT and the corrected gap reading (Rg′) for each gap are defined as;
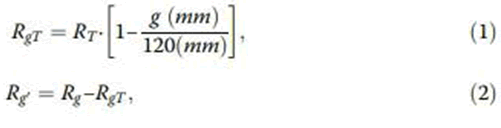
Where;
RT=is the average MLC leaf transmission accounted for bank A and B
g (mm)=is the nominal gap width, the 120 (mm) is the sweeping gap movement range
Rg=is the initial sweeping gap field reading
Rg’=is the corrected gap reading
Results
Effect of gravity on MLC positional accuracy (Static)
Table 1 shows for each cardinal gantry angle, average deviation from the planned nominal MLC location. The amount of deviation was the same for the three gantry angles (0.03 mm) with relatively higher average error of 0.04 mm, and maximum MLC positional error of 0.26 ± 0.005 mm at gantry angle 900. There is no difference in average leaf positional error along gantry angle indicating that gravity had no effect on leaf positional accuracy. This ensures that the actual positions of MLCs during treatment correspond to planned position within the tolerance level of SMLC advocated by Palta, et al. and AAPM TG-142 (1 mm) [18].
| Gantry angle (deg) | Average error (mm) | Max. error (mm) | Leaf and picket# |
| 00 | 0.03 | 0.20→ | L22/P5 |
| 900 | 0.04 | 0.26→ | L36/P7 |
| 1800 | 0.03 | 0.19→ | L6/P1 |
| 2700 | 0.03 | 0.24→ | L33/P3 |
Table 1: Picket Fence test results for different gantry angles for static acquisition.
Profiles of the central leaf pairs (Leaf #30) were plotted and compared as shown in Figure 1 above, for each gantry acquisition. The overlapping profiles at each picket for the four cardinal gantry angles shows gravity has no effect on MLC position.

Figure 1: Super-imposed profiles for the central leaf (Leaf #30) at four gantry angles.
MLC leaf position accuracy in dynamic mode
Analysis of PF patterns for rapid arc plan using Pylinac v3.0 showed that all MLC positions were under set tolerance (<0.5 mm), with an average error of 0.044 mm, and a maximum error of 0.315 mm at picket #7 and leaf #13. The average and maximum error in the dynamic acquisition is higher by 0.004 mm (9.1%) than the respective average error observed at 900 during static delivery.
Leaf positional errors from analysis of dynalog files for RA delivery
The dynalogs from the MLC control computer that recorded MLC positions every 50 ms were analyzed using DFV. The analysis indicated precise positioning of all leaves for the RA PF test pattern. The histogram data of all leaf positions showed that 35.82% were within 0.05 mm, 46.2% between 0.05 and 0.5 mm, 17.98% between 0.5 and 1 mm. The average error RMS (0.28 mm and 0.29 mm) and the maximum error RMS were (0.29 mm and 0.3 mm) for carriage A and B respectively. The histogram of MLC position deviations (169,320 values) indicated 82% of all errors <0.5 mm. The average and maximum RMS error values are less than 0.5 mm, with all the MLC positional error RMS<1 mm.
Accurate control of Dose Rate and Gantry Speed (DRGS)
As indicated in the image of the bands, and the corresponding line profile in Figures 2 and 3, uniform intensity was found across the EPID pattern image, except for the gaps between the strips.
Accurate control of dose rate and gantry speed during RapidArc delivery has been examined by using 7 combinations of dose-rate, gantry range and gantry speed to give equal dose to seven 1.8 cm strips in a RapidArc field. When normalized to open field at same position (to exclude the beam profile influence), the dose of seven strips showed good result, with maximum mean deviation of 0.88% (<3%).

Figure 2: ROI positions using image J (combining different dose rates, gantry angles, and speeds).

Figure 3: Superimposed median profiles of the rapid arc QA plan of the normalized open and closed MLC field for DRGS test.
As indicated in Table 2, the maximum ROI deviation was 0.88% for the last ROI and the minimum deviation (0%) for the fifth band. The overall average of the absolute value of all the ROI deviations is 0.36, which is less than 1.5%.
| Band# | RDR-GS | Ropen(x) | Rcor(x) | Diff (x) | |Diff(x)| |
|---|---|---|---|---|---|
| 1 | -956.503 | -10499.2 | 9.11 | 0.44 | 0.44 |
| 2 | -981.117 | -10879.9 | 9.02 | -0.55 | 0.55 |
| 3 | -983.998 | -10879.5 | 9.04 | -0.33 | 0.33 |
| 4 | -985.719 | -10886.5 | 9.05 | -0.22 | 0.22 |
| 5 | -986.614 | -10882.7 | 9.07 | 0 | 0 |
| 6 | -985.247 | -10849.8 | 9.08 | 0.11 | 0.11 |
| 7 | -964.425 | -10542.5 | 9.15 | 0.88 | 0.88 |
| Mean= | 9.07 | Avg. of abs. | 0.36 | ||
| Deviations | |||||
| Threshold | <1.5% |
Table 2: Results of Dose Rate-Gantry Speed test (DRGS).
Accurate Control of MLC Speed (DRMLC)
This test used four combinations of leaf speed (0.4 cm/s, 0.8 cm/s, 1.4 cm/s, 2 cm/s) and corresponding dose-rates of (120 MU/min, 240 MU/min, 411.4 MU/min, 241 MU/min and 600 MU/min) respectively to give equal dose to four strips in a rapid arc field delivery.
Table 3 shows the maximum ROI deviation is 1.4% below the mean for the first ROI and the minimum deviation (0.13%) is observed for the fourth band. The average of the absolute value of all the ROI deviations is 0.7%. This test evaluated the use of different MLC speed and analysis of the radiation pattern relative to that of the corresponding open field, indicated good agreement in the delivered dose to approximately 0.7%, SD=0.06 for different combinations of MLC speeds (0.4 cm/s, 0.8 cm/s, 1.4 cm/s, 2 cm/s), dose rate (120 MU/min, 240 MU/min, 411.4 MU/min, 600 MU/min) and field width 3 cm. Thus, the accuracy of leaf speed during rapid arc has been validated.
| Band number | 1 | 2 | 3 | 4 | Threshold |
| RLS | -606.74 | -626.743 | -631.86 | -618.683 | |
| ROpen | -10433.5 | -10588.9 | -10610.1 | -10460.6 | |
| Rcorr | 5.82 | 5.92 | 5.96 | 5.91 | |
| Diff(x) | -1.4 | 0.3 | 0.97 | 0.13 | < ±3% |
| Average of absolute deviations (DiffAbs) | 0.7 | <1.5% | |||
Table 3: Results of leaf speed accuracy test during RA delivery.
When normalized to corresponding open field, the dose of four strips showed good result, with a maximum mean deviation of -1.4% (<3%) and average of absolute deviations (DiffAbs) of 0.73% (<1.5%).
Leaf Transmission Factor (LTF)
Table 4 shows, the range of average transmission (1.43%-1.6%) for 6 MV and 10 × 30 cm2 field over the central portion of both banks.
| Chamber position (mm) |
MLC condition | Chamber reading (nC) |
Trans A and B | AVG Trans |
|---|---|---|---|---|
| 2.5 | Open | 31.95 | 0.0158 | |
| MLC A | 0.5021 | 0.0157 | ||
| MLC B | 0.5091 | 0.0159 | ||
| 50 | Open | 32.45 | 0.016 | |
| MLC A | 0.5231 | 0.0161 | ||
| MLC B | 0.5184 | 0.016 | ||
| 52.5 | Open | 32.55 | 0.016 | |
| MLC A | 0.5233 | 0.0161 | ||
| MLC B | 0.5178 | 0.0159 | ||
| 100 | Open | 32 | 0.0157 | |
| MLC A | 0.5008 | 0.0157 | ||
| MLC B | 0.5066 | 0.0158 | ||
| 120 | Open | 31.75 | 0.0144 | |
| MLC A | 0.4573 | 0.0144 | ||
| MLC B | 0.4553 | 0.0143 | ||
| 125 | Open | 31.5 | 0.0143 | |
| MLC A | 0.4505 | 0.0143 | ||
| MLC B | 0.4479 | 0.0142 |
Table 4: Average MLC Transmission at different positions from central axis (+X) for 6 MV and 10 × 30 cm2 field size.
The average MLC Transmission Factor (LTF) for the Bank A and Bank B at 6 MV were (0.01534, 0.01528) with only difference of 0.39% in transmission with the overall percentage average transmission of 1.5% for 6 MV photon beam energy. For 6 MV photon beams, the minimum average transmission values for bank A and bank B with their respective positions from the central axis of the beam were (1.41/-125 mm, 1.43/125 mm) and the maximum average transmission values were 1.6/52.5 mm, 1.59/-50 mm. For 15 MV the minimum average transmission values for bank A and bank B with their respective positions from the central axis of the beam were (1.6/-125 mm, 1.61/125 mm) and the Maximum average transmission values were 1.78/50 mm and 52.5 mm, 1.77/-50 mm and -52.5 mm.
The average of mid leaf transmission and inter leaf leakage is shown in Figure 4 at different positions of chamber from the central beam axis for 6 MV and 15 MV X-rays, normalized to the output of the open field. Relatively maximum average transmission of the MLC was observed at the position of 50 mm and 52.5 mm at 15 MV beam energy (1.78%) with the minimum transmission 1.6% at -125 mm position from the centre of the field.

Figure 4: Comparison of the average leaf transmission in position for 6 MV and 15 MV from the central field.
Figure 5 shows higher transmission values (1.71%) correspond to higher energies and larger field size. The increase in transmission with field size at 15 MV was almost twice of the increase in transmission at 6 MV (5.88% and 10.53%). For the same field size, the increase in energy from 6 MV to 15 MV resulted in an increase in transmission by 5.88% (10 × 10 cm2) and 10.47% (for 10 × 30 cm2).

Figure 5: Distribution of variation of MLC transmission with field size.
Dosimetric Leaf Gap (DLG)
Dosimetric Leaf Gap (DLG) is a parameter to model the roundleaf- end effect of Multi-Leaf Collimators (MLC) that is important for treatment planning dose calculations in radiotherapy. When radiation passes through the rounded leaf end, the transmission affects the radiation field edge.
As shown in Figure 6, the extrapolated gap to obtain zero doses was found to be 1.42 mm and 1.6 mm at 6 MV and 15 MV respectively for our 120 leaves DMLC.

Figure 6: Corrected gap reading in nC vs. gap width graph A (6 MV) and B (15 MV).
Discussion
For intensity modulated IMRT, dose delivery throughout the target volume is sensitive to leaf positioning and leaf transmissions because of the relatively small subfields and the increased Monitor Units (MUs) characteristic of IMRT plans. To gain the actual clinical advantage from IMRT treatment, it must be ensured that the DMLC technology is performed accurately according to the treatment planning parameters. Measurements of the accuracy of MLC leaf position, speed, and accuracy of dose rate was not investigated yet at the study hospital and only patient specific QA may not test the full range of MLC position, MLC leaf speed, dose rate, and gantry speed which are varied throughout the treatment during dynamic delivery. Establishing simple and rapid procedures for QA program for MLCs system is important. Even if there is patient specific quality assurance program in the radiotherapy department of AOUP, there is no clear indicated method described to quantify MLC leaf position errors. Furthermore, there is neither established baseline data on the value of LTF and DLG nor any procedure on the measurement of leaf transmission factor as separate part of QAP of the MLC at AOUP as well as on AAPM TG-142 protocol, which is prepared for static IMRT.
Analysis of PF patterns during rapid arc delivery using Pylinac v3.0, showed that all MLC positions were under set tolerance (<0.5 mm), with an average and maximum errors of 0.044 mm and 0.315 mm respectively. The results of this study for MLC positional accuracy test during both static and rapid arc delivery (<0.5 mm) agree with the results in the literature and tolerance limit of AAPM TG-142 protocol (1 mm). The study result by Budgell, et al., showed that accurate dose delivery for IMRT fields require better than 1 mm accuracy in leaf position which is in line with our study results [19]. ESTRO guidelines propose ± 0.5 mm as acceptance criteria for MLC position accuracy for IMRT, where it possible to set 0.5 mm error as a tolerance level at AOUP. Even very lower tolerance levels of 0.25 mm have been created for MLC positional errors using EPID-based automated PF test and suggested in the literature.
In addition, analysis of EPID based Pylinac software measurement in this study for monitoring of leaf positional error showed lower average error compared to analysis of log file analysis results using DFV (0.044 vs. 0.285 mm) for RA delivery. Relatively higher average RMS position error during rapid arc delivery from analysis of DFV compared to Pylinac results could be related to errors from leaves which are out of 40 central leaves that have been considered by DFV for calculation of average RMS error, whereas only central leaves were considered for analysis using Pylinac. Furthermore, all PF test results were satisfactory confirming the efficient functioning of the DMLC for IMRT fields and shows one of the two techniques could be used for QC of DMLC.
Having stabilised accurate control of MLC position using PF test and Dynalog files analysis, different combinations of dose rates and gantry speed were used to give the same dose to the seven strips, and the normalized dose showed good agreement to 0.36%, providing strong evidence that variable dose rate and gantry speed can be accurately controlled during rapid arc delivery. From analysis of the test patterns for the test on accurate control of dose rate and Gantry Speed, the results were better (less absolute Deviation) than similar study results by Ling, et al. which could be related to use of Varian EPID in this study due to its higher stability compared to films used by study of Ling, et al.
Leaf speed is mostly a concern for the DMLC mode of IMRT. Leaf acceleration and deceleration have a negligible effect on the delivered intensity profiles. However, a sluggish leaf can affect the gap width during delivery, and the MLC software can modulate the dose rate by adding beam hold offs. The results of the leaf speed accuracy test from the current study, showed the range of values of ROI deviation (0.24-1.43%) and the average of the absolute value of all the ROI deviations (0.7%) are well within the values indicated by the Varian provided procedures for the rapid arc QA test related to MLC speed accuracy test (<3% and <1.5% respectively). It shows inaccurate control of MLC speed that could result in increased beam holds or gap width errors is controlled by the LINAC Rapid Arc delivery system. When the LSQA radiation profile was normalized to and superimposed on the profile of the corresponding open MLC field, the result showed that the two profiles were closely matched, which refines the results by Varadharajan, et al. [20]. The result showed well matched profiles at all leaf speeds and dose rates combinations, showing that the LINAC is able control the MLC leaves speed accurately resulting in appropriate dose delivery. From the results of the current study, it is recommended to determine the specific optimal clinical tolerances appropriate for the LINAC in use in AOUP, which could be 2% for diff (x) and 1% for the average of the absolute values of all the ROI deviation.
The MLC cannot block the photon beams completely and a small amount of radiation is transmitted from the leaves. For conventional radiotherapy, such leakage only affects areas outside the treatment field. For IMRT and VMAT, however, MLC leaves often block targets when modulating the photon fluence.
Thus, modeling the LTF is important for accurate dose calculation. Leaf transmissions typically account for 10–15% of the dose delivered to the target volume; however, their optimal values are not universally applied. The average MLC transmission increases with the field size, but most treatment planning systems use a single value, and interleaf effects are often ignored. The decrease in leaf transmission at the lateral positions from the central field, in this study could be related to the relatively large (10 mm) width of leaves at these positions decreasing the contribution from inter leaf transmission to the total transmission due to a smaller number of interleaves which have higher contribution to transmission through the MLC. The relatively lower values of leaf transmission at the central MLCs could be related to the dominant tongue and groove effect from larger number of leaves at the central field, where we expect larger transmission due to increases interleaf transmission.
The results of the overall average leaf transmission at both 6 MV and 15 MV agree with results in literature dealing with the same MLC type, using the same procedure (1.39% and 1.7%) for 6 MV and 15 MV respectively. Similar measurements of transmission properties of a varian MLC have been made by Klein, et al., using radiochromic films. The results showed for 6 MV (1.5%-2%) and 15 MV (2%). These values were higher than the values obtained in the present study using water phantom and farmer type ionization chamber 6 MV (1.41%-1.6%) and 15 MV (1.6%-1.78%),
The overall results related to LTF, showed that the percentage transmission values of the MLC were within the tolerance value recommended by AAPM TG-50 (2%). In addition, there is reduction of transmission at the periphery of the leaves by nearly 0.15% and 0.18% of the central axis transmission for 6 MV and 15 MV beam at 10 cm depth, these changes can be attributed mostly to spectral changes off axis rather than oblique transmission trough the leaves. Using water phantom and PTW30013 Farmer chamber is suggested as a promising technique for the transmission factor measurement. The increase in leaf transmission through the MLC with the field size could be because of increased scatter from the MLC leaves. The results revealed also that the effect of increasing energy from 6 MV to 15 MV had the same effect on increase of transmission as increasing the field size from 10 × 10 cm2 to 10 × 30 cm2. In addition, the increase in pair production within the MLC for higher energies in 15 MV beam may have contributed to increase in transmission with energy at the same field size, resulting in hard beams. In general, the result of LTF from the current study is within the limit of AAPM TG-50 report (2%) suggesting that the results from the current study could be set as the baseline data as reference for future routine QA tests on DMLC as part of QAP and using water phantom and PTW30013 Farmer chamber 0.6 cm3, is suggested as a technique for the transmission factor measurement.
The Dosimetric Leaf Gap (DLG) in Eclipse treatment planning system is determined during commissioning of the TPS and it is used to model the rounded leaf effect of the MLC. This parameter attempts to model the physical difference between the radiation and light field, and accounts for inherent leakage between adjoining leaves. With the increased use of single fraction high dose treatments requiring large MU comes an enhanced concern in the accuracy of leakage calculations, as it accounts for much of the patient dose. When radiation passes through the rounded leaf end, the transmission affects the radiation field edge. In the TPS, this effect is compensated by shifting the leaf tip position by half the value of the DLG when calculating the fluence. The complex high precession technique, such as IMRT, entails the modelling of optimum value of DLG inside eclipse Treatment Planning System (TPS) for precise dose calculation. Therefore, the measurements of DLG in this study serve to verify the dosimetric accuracy of the algorithm used to model the rounded leaf effect for the Varian clinac DHX at AOUP.
The results of DLG of the current study is within the range of a survey made by Isono, et al. worldwide on 69 LINACS from 58 institutions (DLG=1.66 ± 0.21 for 6 MV), using web-based Google Forms (Google LLC, Mountain View, CA, USA) at Sixty-nine sets of linac. For optimization of the parameters for IMRT/VMAT calculations, DLG values were upwardly adjusted at many institutions. In contrast, in the Study by Varadharajan, et al., DLG was found to be 1.44 mm for 120 leaves DMLC (6 MV), and it has been shown in the literature that the DLG values derived from other methods, cross field dose width and film measurements were consistent with sweeping gap technique, with similar results obtained in the current study, ensuring that DLG assessment using this method during commissioning of a TPS is more efficient and accurate.
In general, the dosimetric verification of DMLC movement, variable dose rates and gantry speed provides confidence over precision and accuracy during RapidArc delivery. These tests are aimed only for commissioning and dosimetric verification of RapidArc enabled linac, and not for patient specific QA. The concepts and findings have broad implications for IMRT with DMLC and the methods may be applicable to MLC of other designs as well. Further study is needed, to develop inhouse software, to quantify the loss in leaf speed as required by AAPM TG 142-Report and investigate the dosimetric effect of errors in MLC positional errors. This is an initial attempt in designing a quality assurance protocol for DMLC and could provide the first step forward to ensure accurate and reliable delivery of Rapid arc related to quality assurance of MLC. Further, other investigators in the field, can use the protocols of the current study for further wider studies. Other AAPM TG-142 tools provided by pylinac in other modules could be used for analyzing QA image data provided by the LINAC during rapid arc delivery (e.g. VMAT module and dynalog files analysis module). Finally, methods of measurement of MLC transmission (annual test) and DLG (during commissioning) of a new TPS could be used for any other units and centers.
Conclusion
EPPID based PF analysis using Pylinac and Dynalog File Viewer are fine and comparable to analyze the MLC positional errors as required by the AAPM task group 142 report for MLC QA and we propose ± 0.5 mm as tighter acceptance criteria for MLC position accuracy for IMRT. The study showed, MLC speed accuracy could be evaluated using ImageJ and manufacturer provided DICOM QA plan files for rapid arc. Furthermore, the results of the tests in this study provide strong evidence that DMLC movement, Variable dose rate and gantry speeds can be precisely controlled during rapid arc and procedures applied here can be used by QMP to design Quality Assurance Program (QAP) for DMLC in their dynamic control in their department, establish baseline data. Since only the profile of the central leaf is used for DRGS and evaluation of accurate control of leaf speed in this study, other researchers can use other modules of Pylinac that could be used for analysis of DRGS, DMLC and dynalog files analysis as part of QA of the DMLC for better control the dose delivery during rapid arc in their department.
Acknowledgement
I sincerely appreciate my Supervisor, Dr. Stefania Linsalata, who has been my supervisor during my clinical practice, for offering timely criticism and corrections that led me through the various stages of this project for successful completion of this work. Finally, I would like to thank all the staff members of the department of Fisica Sanitaria of the Azienda Ospedaliero Universitaria Pisana (AOUP). The last, but not the least, thanks go to the IAEA and ICTP for giving this fellowship of two years during my study.
Conflict of Interest Statement
The author has no conflicts of interest to declare and have seen and agreed with the contents of the manuscript and there is no financial interest to report. The Author certifies that the submission is original work and is not under review at any other publication.
Funding Availability
None.
Data Availability Statement for This Work
Research data will be shared upon request to the corresponding author.
References
- Keall PJ, Cattell H, Pokhrel D, Dieterich S, Wong KH, et al. (2006) Geometric accuracy of a real-time target tracking system with dynamic multileaf collimator tracking system. Int J Radiat Oncol Biol Phys 65:1579-1584
[Crossref] [Google Scholar] [PubMed]
- Liang Y, Xu H, Yao J, Li Z, Chen W (2009) Four-dimensional intensitymodulated radiotherapy planning for dynamic multileaf collimator tracking radiotherapy. Int J Radiat Oncol Biol Phys 74:266–274
[Crossref] [Google Scholar] [PubMed]
- Yan G, Liu C, Simon TA, Peng LC, Fox C, et al. (2009) On the sensitivity of patient-specific IMRT QA to MLC positioning errors. J Appl Clin Med Phys 10:120-128
[Crossref] [Google Scholar] [PubMed]
- Smith K, Balter P, Duhon J, White GA Jr, Vassy DL Jr, et al. (2017) AAPM Medical Physics Practice Guideline 8. a.: linear accelerator performance tests. J Appl Clin Med Phys 18:23-39
[Crossref] [Google Scholar] [PubMed]
- Ling CC, Pengpeng Z, Archambault Y, Bocanek J, Tang G, et al. (2008) Commissioning and quality assurance of Rapidarc radiotherapy delivery system. Int J Radiat Oncol Biol Phys 72:575–581
[Crossref] [Google Scholar] [PubMed]
- Losasso T (2008) IMRT delivery performance with a Varian multileaf collimator. Int J Radiat Oncol Biol Phys 71:S85–S88
[Crossref] [Google Scholar] [PubMed]
- Sastre-Padro M, Welleweerd J, Malinen E, Eilertsen K, Olsen DR, et al. (2007) Consequences of leaf calibration errors on IMRT delivery. Phys Med Biol 52:1147-1156
[Crossref] [Google Scholar] [PubMed]
- Yang Y, Xing L (2004) Quantitative measurements of MLC leaf displacements using an electronic portal image device. Phys Med Biol 49:1521–1533
[Crossref] [Google Scholar] [PubMed]
- Litzenberg DW, Moran JM, Fraass BA (2002) Verification of dynamic and segmental IMRT delivery by dynamic log file analysis. J Appl Clin Med Phys 3:63–72
[Crossref] [Google Scholar] [PubMed]
- Luo W, Li J, Price RA Jr, Chen L, Yang J, et al. (2006) Monte Carlo based IMRT dose verification using MLC log files and R/V outputs. Med Phys 33:2557-2564
[Crossref] [Google Scholar] [PubMed]
- Huang L, Zhuang T, Mastroianni A, Djemil T, Cui T, et al. (2016) Impact of small MU/segment and dose rate on delivery accuracy of volumetricâ?ÃÂmodulated arc therapy (VMAT). J Appl Clini Med Phys 17:203-210
[Crossref] [Google Scholar] [PubMed]
- Klein EE, Hanley J, Bayouth J, Yin FF, Simon W, et al. (2009) Task Group 142 report: Quality assurance of medical accelerators. Med Phys 36:4197-4212
[Crossref] [Google Scholar] [PubMed]
- LoSasso T, Chui CS, Ling CC (1998) Physical and dosimetric aspects of a multileaf collimation system used in the dynamic mode for implementing intensity modulated radiotherapy. Med Phys 25:1919–1927
[Crossref] [Google Scholar] [PubMed]
- Isono M, Akino Y, Mizuno H, Tanaka Y, Masai N, et al. (2020) Inter-unit variability of multi-leaf collimator parameters for IMRT and VMAT treatment planning: a multi-institutional survey. J Radiat Res 61:307-313
[Crossref] [Google Scholar] [PubMed]
- Boyer A, Biggs P, Galvin J, Klein E, LoSasso T, et al. (2001) AAPM Report No. 72: Basic applications of multileaf collimators. Med Phys 36:4197-4212
- Chui CS, Spirou S, LoSasso T (1996) Testing of dynamic multileaf collimation. Med Phys 23:635-641
[Crossref] [Google Scholar] [PubMed]
- van Esch AP, Huyskens D, Behrens CF, Samsoe E, Sjölin M, et al. (2011) Implementing RapidArc into clinical routine: a comprehensive program from machine QA to TPS validation and patient QA. Med Phys 38:5146-5166
[Crossref] [Google Scholar] [PubMed]
- Palta JR, Liu C, Li JG (2018) Quality assurance of intensity modulated radiation therapy. Int J Radiat Oncol Biol Phys 71:S108-S112
[Crossref] [Google Scholar] [PubMed]
- Budgell GJ, Mott JH, Williams PC, Brown KJ (2000) Requirements for leaf position accuracy for dynamic multileaf collimators. Phys Med Biol 45:1211-1227
[Crossref] [Google Scholar] [PubMed]
- Varadharajan E, Ramasubramanian V (2013) Commissioning and Acceptance Testing of the existing linear accelerator upgraded to volumetric modulated arc therapy. Rep Pract Oncology Radiother 18:286-297
[Crossref] [Google Scholar] [PubMed]

Open Access Journals
- Aquaculture & Veterinary Science
- Chemistry & Chemical Sciences
- Clinical Sciences
- Engineering
- General Science
- Genetics & Molecular Biology
- Health Care & Nursing
- Immunology & Microbiology
- Materials Science
- Mathematics & Physics
- Medical Sciences
- Neurology & Psychiatry
- Oncology & Cancer Science
- Pharmaceutical Sciences