Review and Commentary on Design and Development of a Phantom for Tomosynthesis with Potential for Automated Analysis via the Cloud
David J Goodenough
David J Goodenough*
Department of Radiology, The George Washington University, Washington, DC, USA
- *Corresponding Author:
- David J Goodenough
Department of Radiology, The George Washington University, Washington, DC, USA;
E-mail: goodenough@gwu.edu
Received Date: December 17, 2020; Accepted Date: January 01, 2021; Published Date: January 08, 2021
Citation: Goodenough DJ (2021) Review and Commentary on Design and Development of a Phantom for Tomosynthesis with Potential for Automated Analysis via the Cloud. Insights Med Phys Vol. 6 No. 1: 01.
Abstract
This article is designed to review and comment on the publication entitled “Design and development of a phantom for tomosynthesis with potential for automated analysis via the cloud”. The original article describes the development of a phantom designed to be responsive to the ideas and suggestions of a number of potential regulatory and standards groups interested in measuring physical parameters of Digital Breast Tomography (DBT) systems. This review is intended to summarize some of the design aspects and initial results and comments from the users, of the phantom and analysis software.
Keywords
Medical physicists; Phantom; Tomophan; Mammography
Introduction
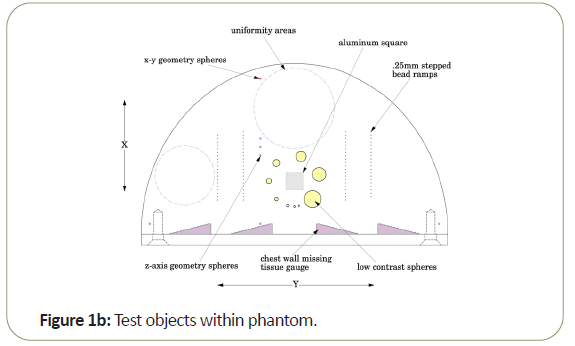
In particular, the phantom design cited in the article is the Tomophan®(The Phantom Laboratory, Salem, NY), and the cloud- based analysis system (Smári Image Analysis Service) offered through The Phantom Laboratory. The phantom and analysis software allow the user to measure: Signal to Noise Ratio (SNR); and Contrast to Noise Ratio (CNR); Noise Power Spectrum (NPS); Spatial linearity (pixel size); Regional in plane uniformity and Global Uniformity; High Resolution MTF in both x and directions; Lost Chest Wall Tissue; and Low Contrast Spherical Targets [1].
Literature Review
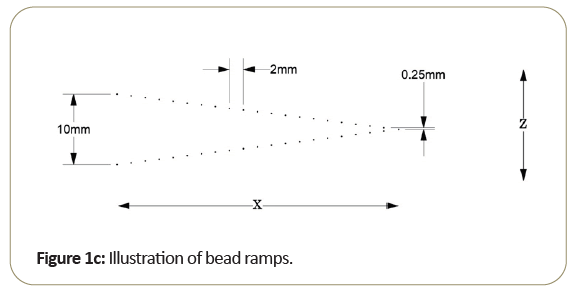
One of the key aspects of the Tomophan®is the inclusion of angled ramps of small beads that move through the z-axis of the phantom. These beads allow determination of the Tomo slice thickness and the slice sensitivity profile SSP (z). In addition, each bead presents essentially a “point source” from which the Point Spread Function (PSF) may be determined and the resulting data can also be (Fourier) transformed to calculate the Modulation Transfer Function (MTF).
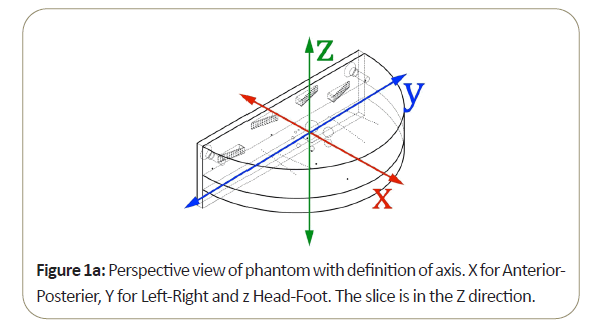
Most of the work reported in this review has been conducted with the Tomophan®phantom coupled with automated Smári image analysis service. The design features are seen in the schematic drawings of the (Figures 1a-1c).
It should be noted that DBT systems use limited angle reconstruction techniques, and DBT systems are not really linear, position independent neither (isoplanatic, nor isovolumetric) systems. The MTF (Modulation Transfer Function) may not rigorously apply to DBT because it is not a linear, position independent system. The Fourier transform of the point spread function to produce what is called an “MTF”, realizing the caveats to formal use.
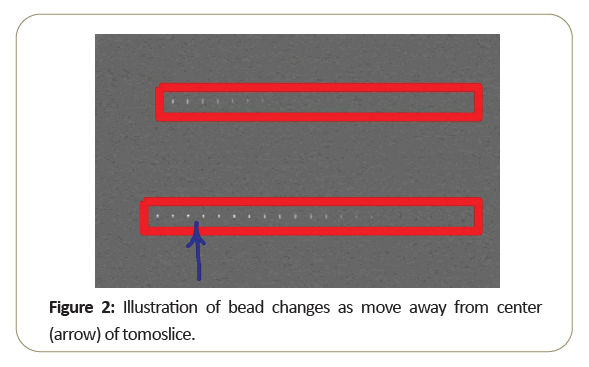
These concepts can be visually appreciated by examining the attached in Figure 2, from a single slice through the bead ramps. The arrow marks the center of the slice. As the beads step away from the center, they blur indicating reduced resolution and decreased sensitivity.
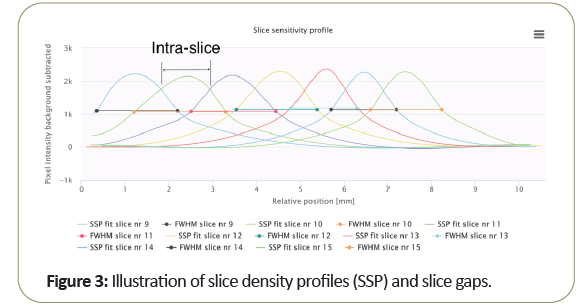
Figure 3 shows the plot of multiple slice profiles indicates the normal slice width as related to the system intra-slice gap, which is generally different from the slice width (FWHM) measurement as shown above.
An example of the SMARI software analysis for slice width is given in Tables 1 and 2 indicated below.
| Slice widths | |||
|---|---|---|---|
| Series description: ROUTINE3D_VOL_RCC | |||
| Slice | Upper (mm) | Lower (mm) | Average (mm) |
| Slice nr 10 | 1.75 | 1.56 | 1.66 |
| Slice nr 11 | 1.78 | 1.71 | 1.75 |
| Slice nr 12 | 1.9 | 1.69 | 1.79 |
| Slice nr 13 [center] | 1.74 | 1.53 | 1.63 |
| Slice nr 14 | 1.69 | 1.77 | 1.73 |
| Slice nr 15 | 1.61 | 1.91 | 1.76 |
| Slice nr 16 | 1.57 | 2.09 | 1.83 |
| Average | 1.72 | 1.75 | 1.74 |
| Standard deviation | 0.11 | 0.2 | 0.07 |
Table 1: SMARI software analysis for slice width.
| Remaining signal within the increment | |||
|---|---|---|---|
| Series description: ROUTINE3D_VOL_RCC | |||
| Slice | Upper (%) | Lower (%) | Average (%) |
| Slice 10 | 75.5 | 76.2 | 75.8 |
| Slice 11 | 78.6 | 74.1 | 76.4 |
| Slice 12 | 78.7 | 72.8 | 75.7 |
| Slice 13 | 75.9 | 70.1 | 73 |
| Slice 14 | 69.5 | 76.4 | 73 |
| Slice 15 | 71.1 | 80.1 | 75.6 |
| Slice 16 | 71.1 | 82 | 76.5 |
| Average | 74.3 | 76 | 75.1 |
| Standard deviation | 3.8 | 4.1 | 1.5 |
Table 2: Signal within the increment.
The data is uploaded from the Dicom header and is available as either a full system report or summary version. Tomophan/ Smári users respond that the missed chest wall ranges from close to zero mm up to a few mm depending on the system vendor being tested, with nominal slices ranging from 1 mm to 5 mm. Of course, any given phantom scan is subject to statistical effects of the noise in the scan, primarily related to the dose used to obtain the image. Repeated scans can be used to study the effects of reduced noise, and it is found that even at basic acquisition protocols the data is quite repeatable and the results are useful to measure and maintain constancy of performance which is probably the major use of a Quality Assurance phantom, along with a teaching tool for physicians and medical physicists to learn and teach basic imaging performance evaluation of DBT systems.
Two major questions that arise from current users relate to: resolution differences between classical Digital Mammography and DBT; and the degree to which structure noise from dense breast examinations may mitigate results or limit application to the actual clinical case with complex anatomy. Extending the phantom to include structure-type objects to mimic some of the dense breast challenges is currently under study with The Phantom Laboratory and ImTECH at Oslo University.
Digital Breast Tomosynthesis (DBT) imaging has been recognized for its value as a diagnostic tool by increasing detection of abnormalities and reducing false positives vs. traditional mammography [1-4]. However, unlike cone beam CT, DBT only reconstructs from a small arc vs. 180° and more commonly 360° rotations used with CT. DBT systems utilize a variety of acquisitions arcs and sequences, creating significant performance variations. In particular, the limitations of DBT spatial resolution as compared to digital mammography and classical film/screen systems raise questions as far as DBT performance in detecting micro calcifications which generally appear as white specks on a mammogram. These specks have typically diameters from 0.1 mm to 1 mm with average diameters of 0.3 mm. Typically, these specks have limited detectability due to structure noise and statistical noise from finite radiation dose; then too, is the case of DBT with typical spatial resolution levels of 3-5 lp/mm (on the order of 0.1 mm). Significant intra-slice variations in resolution along with significant differences between the variations in different DBT systems, has been observed. These variations highlight the need to better test and understand DBT slice geometry.
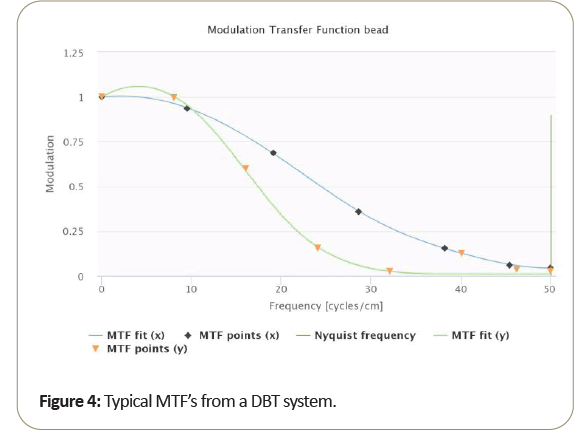
A typical MTF resulting from DBT is shown in Figure 4.
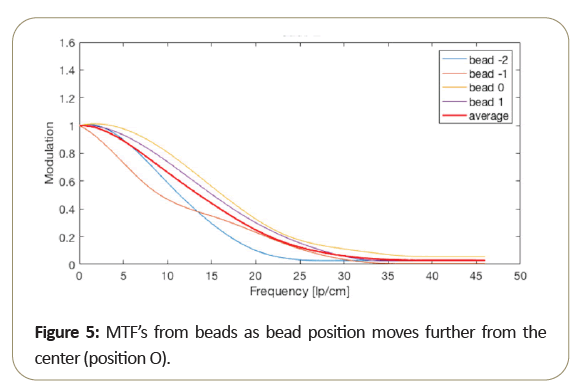
Due to the motion direction of the tomosynthesis system, the x and y MTF measurement are known to vary significantly and seen from measurements taken from the bead. Then too, as shown in the Figure 5, MTF amplitude variability resulting from small bead use, at critical frequencies of 50%, 10%, 5%. 2% as shown in Table 3 range from about 15% to 10% standard deviation from the average MTF. To further reduce variability of thin slice DBT, may be best to average the “peak” bead signal within the slice to minimize the variation due to intraslice sensitivity variation. To reduce MTF measurement variability of thin slice DBT, to below 10%, it may be best to average the peak bead from multiple scans and/or multiple slices.
The peak intra-slice bead is best-case (highest resolution) measurement, and certainly average of all the beads in the intra-slice may be an alternate measurement of overall expected performance. Notice that bead 0, which is closest to the center, performs better than the beads further from the center.
The importance of intraslice variations may be entended to considerations of the visualization of small calcified specks in clinical images. Additional comparisons with the PSF/MTF approaches in the Tomophan®vs. some of the approaches using angled wires, or edge response functions can be found in an internal interim report from the AAPM Tomosynthesis Quality Control Task Group 245, David Scaduto, lead author [5].
Clinical implications of intra-slice variability
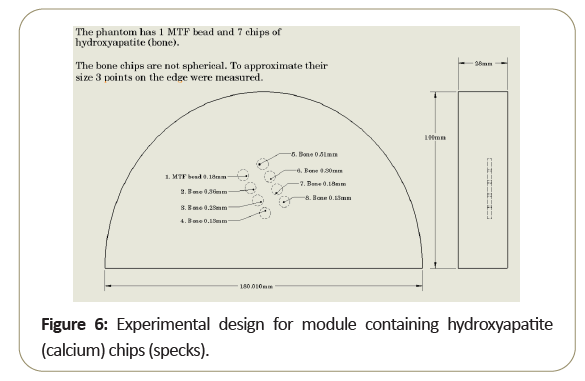
The difference between the performances of beads within the intra-slice indicates that a small calcified object which can be visualized in the center of the scan slice may not be visible when it is located closer to the intra-slice edge. To illustrate this problem, a simple phantom with different sized hydroxyapatite chips to model calcified specks, was developed as shown in Figure 6.
The phantom was then scanned multiple times, each time lifted (z-direction) by 0.1 mm. Note while the larger objects was seen in all slices, the smaller objects disappear as one moves away from the slice center [6].
This variability in resolution of MTF bead signal and calcified specks is expected to be present in clinical evaluations. The position of a small calcified speck within the DBT slice does affect resolution and the charge in visualization within the slice is noted. These results are the subject of a future paper [6].
Conclusion
Additional study is needed to determine how best to use phantoms and analysis separate to assess DBT performance, particularly resolution and resolution variability in DBT. There is also work needed to help relate the physics performance of phantom measurements to clinical reference wherein structure from Dense Breast may limit small speck and speculation detection and low contrast lesions.
Acknowledgements
The reviewer would like to acknowledge the coauthors of the original article, and the help and comments from the scientists at ImTECH at Oslo University Hospital, Oslo, Norway.
References
- Goodenough D. Levy J, Olafsdottir H, Olafsson I (2018) Design and development of a phantom for tomosynthesis with potential for automated analysis via the cloud. J Appl Clin Med Phys 19: 291-300.
- Pissano ED, Yaffic MJ (2014) Breast Cancer screening using tomosynthesis in combination with digital mammography. JAMA 311: 2488-2499.
- Dobbins JT, Godfrey DJ (2003) Digital x-ray nomenythesis: current state of the art and clinical potential. Phys Med Siol 48: R65-106.
- Sechopocalox I (2013) A review of breast senorythesis. Part II. Image reconstruction, processing and analysis, and advanced applications. Med Phys 40: 014302.
- Scaduto DA, Goodsitt M, Chan HP, Olafsdottir H, Das M, et al. (2016) Measuring spatial resolution in digital breast tomosynthesis: Internal report of the AAPM tomosynthesis quality control task group 245. Int J Med Phys Res Pract 43: 3818-3818.
- Levy J, Goodenough D, Whitaker M (2020) The Need for Intra-Slice Measurements of Resolution in Digital Breast Tomography (DBT) with Special Emphasis on Detecting Calcified Specks: Poster, Winter Institute for Medical Physics, Colorado, Spring.
Open Access Journals
- Aquaculture & Veterinary Science
- Chemistry & Chemical Sciences
- Clinical Sciences
- Engineering
- General Science
- Genetics & Molecular Biology
- Health Care & Nursing
- Immunology & Microbiology
- Materials Science
- Mathematics & Physics
- Medical Sciences
- Neurology & Psychiatry
- Oncology & Cancer Science
- Pharmaceutical Sciences
