The Adsorption and Conductivity of Silicon in Elastic Polymers
Teh-Hua Tsai and Pi-Pai Chang*
Department of Chemical Engineering and Biotechnology, National Taipei University of Technology, Taipei, Taiwan
Published Date: 2024-08-06DOI10.36648/2574-285x.9.2.71
Teh-Hua Tsai and Pi-Pai Chang*
Department of Chemical Engineering and Biotechnology, National Taipei University of Technology, Taipei, Taiwan
- *Corresponding Author:
- Pi-Pai Chang
Department of Chemical Engineering and Biotechnology, National Taipei University of Technology, Taipei,
Taiwan,
E-mail: s1618017@ntut.org.tw
Received date: July 24, 2024, Manuscript No. IPIMP-24-19433; Editor assigned date: July 26, 2024, PreQC No. IPIMP-24-19433 (PQ); Reviewed date: July 29, 2024, QC No. IPIMP-24-19433; Revised date: July 31, 2024, Manuscript No. IPIMP-24-19433 (R); Published date: August 06, 2023, DOI: 10.36648/2574-285x.9.2.71
Citation: Tsai TH, Chang PP (2024) The Adsorption and Conductivity of Silicon in Elastic Polymers. J Med Phys Appl Sci Vol.9 No.2: 71.
Abstract
Silicon (Si) is the primary material of semiconductor elements. For semiconductor element production, Si is to be refined into high-purity silicon crystals with the approximate characteristics of intrinsic semiconductor, then doping 13th group or 15th group trace element. Producing high-purity silicon crystals with a good lattice structure requires a lot of energy and is costly. Besides its high purity, silicon is very hard and fragile, which limits its scope of application. For this reason, this study added low-grade, non-complete lattice silicon in the elastic polymer and then doped it with high concentrations of fine carbon powder. This material can be conductive by physisorption; therefore, it can be used to make semiconductors. Using this material to produce electronic components can significantly reduce the cost of purification and crystallization, saving energy simultaneously. Moreover, this elastic polymer material contains silicon, which has soft, warm and durable physical properties. With those properties, the device's design could be more flexible, fully scalable, and close to the skin.
Keywords
Elastic polymer; Adsorption; Conductivity; Silicones; Physisorption; Molecular packing
Introduction
Conducting polymers has improved the sensitivity of various sensors due to their excellent electrical conductivity and charge transfer properties [1]. Conducting polymers hold the advantages of promise as flexible, inexpensive materials for use in electronic applications, including solar cells, light-emitting diodes and chemiresistor type sensors [2-4]. Therefore, a simple, scalable, cost-effective deposition technique for conducting polymers that reproduces a uniform thin film morphology is needed [5].
This study investigated the electrical characteristics of elastic silicon polymers, such as resistance temperature, conductivity, etc. The results showed that elastic silicon polymers can be broadly applied to producing heating devices, temperature control systems, sensors, variable resistors and other fields.
Absorption and conductivity
Polymers can be deposited in a desired location on any surface, such as film, glass and metal [6]. After heating the elastic polymer material, which doped carbon and silicon, the low melting point polymer will completely dissociate and evaporate, leaving high melting point carbon and silicon particles. The quality and size of those particles are the same as before. Therefore, there is no chemical reaction between the carbon, silicon and elastic polymers, only physisorption. Carbon's pore size causes physisorption and intermolecular attraction can occur in any material. However, the adsorptions of each material are very different. Therefore, when carbon adsorbs with various chemical compositions in elastic polymers will have different resistivity.
Adsorption by porous adsorbents is a possible means of removing some of the volatile toxicants from smoke [7]. Despite the litany of reported methods, including electrostatic adsorption [8], their limitations range from reproducibility issues and cost-effectiveness to lack of scalability. Therefore, a universal solution is needed that reliably deposits any conducting polymer film on any substrate [5]. The experimental results showed that the elastic polymer containing silicon would significantly reduce the resistance and thus increase the conductivity of the elastic polymer.
The characteristics of silicon in polymer
Organic silicon polymers contain silicon atoms in the molecular structure, usually called silicones. Silicones are polymers with alternating table structures composed of silicon and oxygen atoms. The basic unit is —Si—O—. The silicon atoms also connect with various organic functional groups, such as methyl, ethyl, phenyl, etc. Those compounds are semi-organic and semi-inorganic polymers. The oxygen plasma can promote the -OnSi (OH)4 -n group on the silicon surface, which is highly dependent on the intensity of oxygen plasma and the treatment time [9].
The chemical structure of the silsesquioxane family is defined as RnSinO1.5 n, which consists of an inner inorganic framework of silicon and oxygen atoms externally covered by organic groups (R) [10]. R may be hydrogen or an alkyl, alkene, aryl and arylene. Based on their molecular architecture, silsesquioxanes can be classified into two categories: Non-caged and caged nanostructure. The non-caged silsesquioxane molecules can be classified into random, ladder and partial cage nanostructures [11]. The ladderlike polysilsesquioxanes include poly (phenyl silsesquioxane), poly (methyl silsesquioxane) and poly (hydrido) silsesquioxane [12-14]. The enormous importance of organosilicon compounds in both polymer and synthetic organic chemistry provided satisfactory methods for the installation of the dimethylsilanol unit through (1) the addition of organometallic compounds to silicon electrophiles followed by simple or oxidative hydrolysis, (2) transition metal-catalyzed hydrosilylation and (3) silyl insertion [15-20]. Silanols are not well-known as reagents in organic synthesis, but they are air and water-stable reagents that can be chromatographed on silica gel and distilled [21].
Materials and Methods
Elastic silicon polymers
Because organic silicon polymers are semi-organic and semiinorganic polymers, they have a lot of excellent performance, like high-temperature tolerance, unaging, insulation, hydrophobia, fireproofing and chemically inert; some silicon polymers can even resist corrosion and electromagnetic waves. The performance of silicon polymers is much better than that of others; therefore, silicon polymers can widely be used in electronics, chemicals, machinery, construction, textiles, transport, medicine and other fields [22,23]. According to the above, this study produced semiconductors by doping high concentrations of graphite into silicone polymers; we hope it can be widely used in electronic technology. Here, we develop this phenomenon into a solution based method to grow films of nanostructured conducting polymers that could facilitate their use in applications ranging from actuators to sensors [24,25].
The structure of elastic silicon polymers
The structure of elastic silicon polymers is related to the chemical bond, molecular structure, polymer structure, etc. This research uses a Scanning Electron Microscope (SEM) to facilitate a follow-up study to analyze the polymers' structural and bonding structure.
The polymer composite materials used in this study
The composite materials are defined as a combination of two or more materials that form three-dimensional working materials. The composite materials with two ingredients can adopt the additive rule of different ingredients' properties to infer mechanical characteristics. For example, to express the elastic modulus of composite materials showing as
E=ΦmEM+forientΦDED → (1)
ΦM:Matrix's volume fraction of composite materials.
ΦD:Dopant's volume fraction of composite materials.
EM:Matrix's elastic modulus of composite materials.
ED:Dopant's elastic modulus of composite materials.
forient:Orientation factor.
If the dopant of composite materials whose orientation and stress are in the same direction, then forient=1. If the dopant is three-dimensional in any direction, then forient=1/6. If the dopant is two-dimensional in any direction, then forient=1/3. If the direction of the dopant is crossed vertically, then forient=1/2. By (Formula 1) inferring to acquire.
ΦM=(1-ΦD) → (2)
Formula 1 indicates the compound intensifies the effect of composite materials. Formula 1 knows composite materials have good mechanical characteristics because the external force can be uniformly distributed over the matrix. Furthermore, the material results in partial defects in the region under the composite materials manufacture process, which strain or stress can also be caused via matrix scattered to increase mechanical characteristics.
This study adopts saturated alkanes molecular polymer as a matrix to analyze and compare with the spectrum conveniently. To further research the function of chemical bond energy, this study uses two macromolecule materials: Saturated alkanes and silicon as composite materials matrix.
SEM analysis
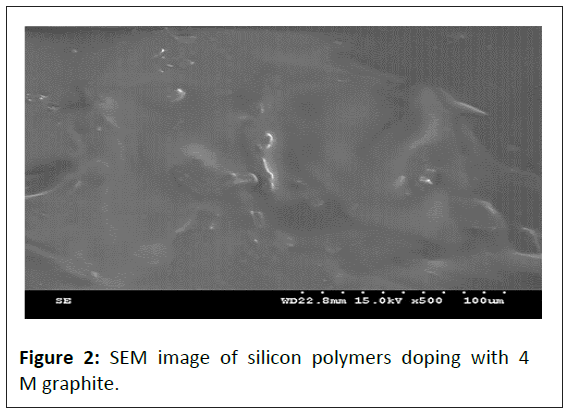
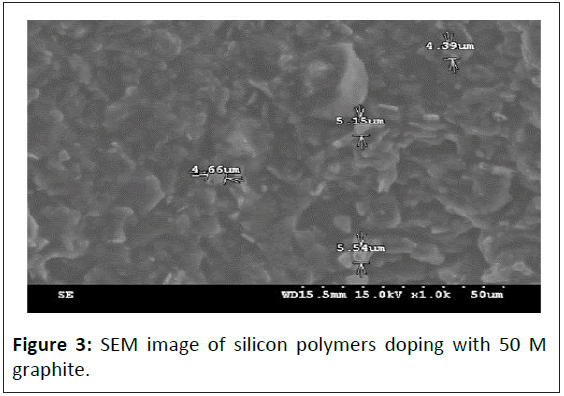
The molecular packing for polymer has a major impact on its physical properties. The carbon physisorption reduces the polymer intermolecular distance and largely increases intermolecular attraction. Adsorptions for different doping densities of polymeric rubberlike material are observed by SEM electron and images are shown in Figures 1-4. Figure 1 is an SEM image of silicon polymers doping with 0 M graphite. Figure 2 is an SEM image of silicon polymers doping with 4 M graphite. Figure 3 is an SEM image of silicon polymers doping with 50 M graphite. Figure 4 is an SEM image of polyurethane rubber doping with 75 M graphite. SEM analysis showed that the graphite particles are independent, the average particle size of graphite particles is 5 μm, and there is no chemical reaction between any particles.
The polymer's second level of key knot strength and macromolecular weight will cause high intramolecular residual force. High carbon doping density has enormous attractions for making molecular piles up closely and presents a high regularity structure. Since the polymer has a huge molecular weight and structure flaw, it cannot be arranged in parallel.
EDX analysis
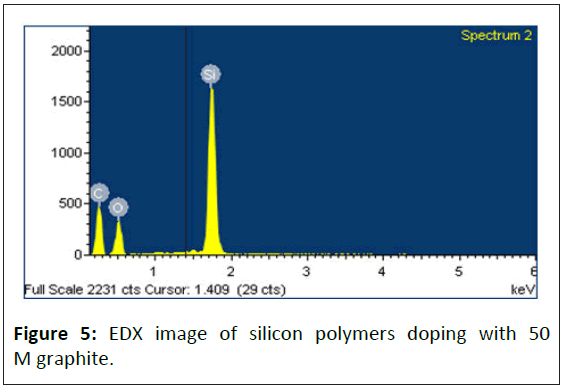
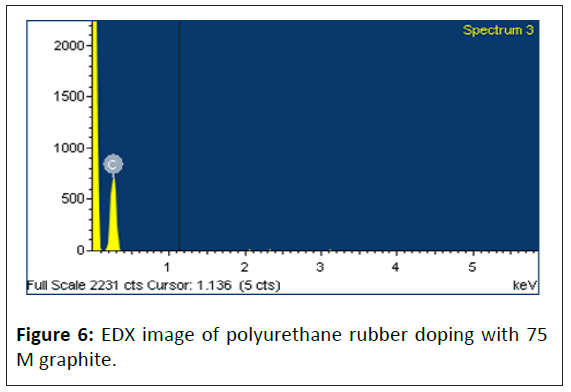
This study uses Energy-Dispersive X-ray (EDX) to investigate the composition and content of polymer specimens. Figures 5 and 6 and Table 1 are the EDX analysis results. Those results showed that the silicon polymer specimen contained 13% silicon after 50 M graphite doped, suggesting that silicon atomic structure highly affects the adsorption and conductivity of polymers.
| Sample | A | B | ||
|---|---|---|---|---|
| Element | Weight% | Atomic% | Weight% | Atomic% |
| C | 49.64 | 62.58 | 95.29 | 96.42 |
| O | 25.21 | 23.86 | 4.71 | 3.58 |
| Si | 25.15 | 13.56 | - | - |
| S | - | - | - | - |
| Totals | 100 | - | 100 | - |
Table 1: The EDX analysis results. A: Silicon polymers doping with 50 M graphite specimen; B: Polyurethane rubber doping with 75 M graphite specimen.
The infrared absorption spectrum analysis
The method to measure organic compounds' structure by infrared spectrum has advantages such as measuring time in seconds, using few samples and quantitative analyzing exactly; therefore, the infrared spectrum becomes a common method to identify organic compounds. The wavenumbers, especially between 1500 m-1 and 600 cm-1, referred to as fingerprint area are closely linked to the molecules, which can be used to distinguish the difference between two compounds.
By experiment, this study discovers that the physisorption of dopant for elastic polymer composite materials greatly influences fingerprint area and results in electric conductivity. The influence on fingerprint area is the most special theory about physisorption that affects the infrared absorption spectrum.
The source of the infrared spectrum is molecular vibration, which results from the transition of molecular vibration's energy levels, referred to as the molecular vibrant spectrum. The main characteristics of the spectrum band have three properties: Frequency (wavenumber), absorbable intensity, and waveform. Those properties are affected by outside experimental conditions and closely related to the chemical structure of the molecule, steric geometric structure, the force field structure within the molecule, distribution of electronic cloud and characteristics of the atomic nucleus, etc.
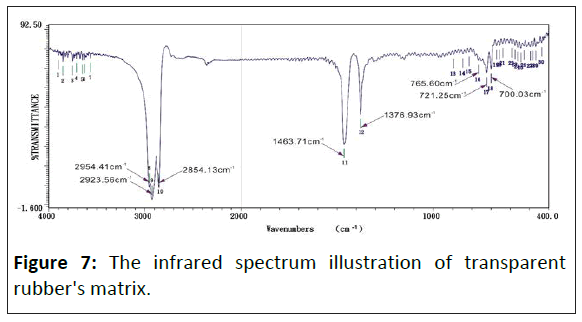
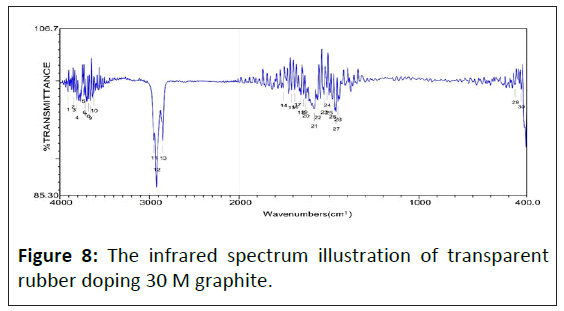
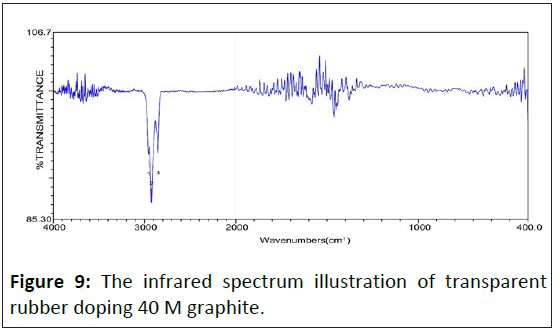
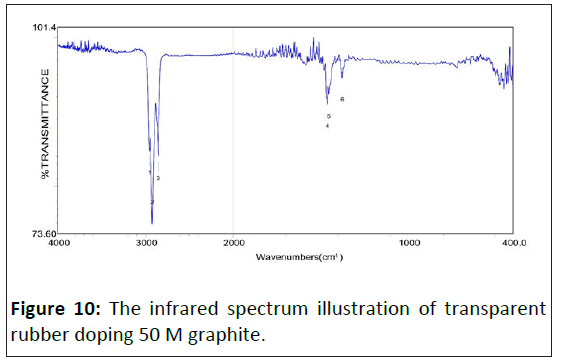
The infrared spectrum of saturated alkane polymer composite materials: Figure 5 is the study that shows the infrared absorption spectrum of transparent rubber's matrix, whose adsorb peak has eight sets mainly. The wavenumbers of adsorb peak value show as following individually: 08) 2954.41 cm-1, 09) 2923.56 cm-1, 10) 2854.13 cm-1, 11) 1463.71 cm-1, 12) 1376.93 cm-1, 16) 765.60 cm-1, 17) 721.25 cm-1, 18) 700.03 cm-1. Figures 7-10 show the infrared spectrum illustration of transparent rubber doping different concentrated graphite.
With graphite's doping concentration increasing, the adsorbability of lower energy chemical bonds decreases sharply, which leads to original strong adsorbabilities such as 1470 cm-1 and 1350 cm-1 almost disappearing. Therefore, wavenumbers less than 1500 cm-1, which adsorb peak value almost disappeared. The spectrum of lower energy's fingerprint area has almost disappeared. Except for the C-H bond, other adsorb peak values, higher and lower energy areas, are positive in inverse ratio to electric conductivity.
In 4000~1500 cm-1 wavenumbers area, the characteristic absorption peak of functional groups appears most. Those areas can be distinguished whether functional groups exist or not. By the infrared absorption spectrum to acquire which the main ingredient of transparent rubber is saturated alkanes. The transparent rubber's saturated alkanes only include C-C and CH saturated covalent bond's absorption spectrum and the absorption spectrum resulting from the change of covalent bonds includes angle. The characteristic infrared spectrum of transparent rubber results from chemical bond varied vibration. The major kind of characteristic infrared spectrum is shown below:
- CH3 cationic groups: The -CH3 cationic groups have four spectrum bands, which individually lie in νas=2960 cm-1, νs=2870 cm-1, νϕ,as=1450 cm-1 and νϕ,s=1380 cm-1 nearby and no more than by 20 cm-1 generally, which relative strength is νas>νs>>νϕ, as≈νϕ,s. Infrared absorption spectrum analysis is used to acquire the transparent rubber's matrix -CH3 cationic groups.
- CH2- cationic groups: The -CH2- cationic groups have three spectrum bands, which individually lie in νas=2920 cm-1, νs=2850 cm-1 and νϕ,as=1465 cm-1 nearby and the same as -CH3 no more than by 20 cm-1 generally, which relative strength is νas>νs>>νϕ, as. By infrared absorption spectrum analysis to know that the adsorb strength about -CH3 of transparent rubber's matrix is greater than -CH2- cationic groups.
-(CH3)n- cationic groups: When n greater than four, owing to - CH2 - cationic groups vibrates that makes infrared absorption spectrum band of cationic groups lie in 720 cm-1 nearby. By infrared absorption spectrum analysis to know that the transparent rubber's matrix only includes C-C and C-H saturated covalent bonds and the absorption spectrum of covalent bonds includes angle, which molecular structure is straight chain saturated alkanes, not naphthenes (also called cycloalkane) (Table 2).
| Cationic groups | Position of absorption peak / cm-1 | Characteristic of the absorption peak |
|---|---|---|
| νc—H | 2900∼2850 | Double peak |
| δc—H | 1465∼1340 | Wide peak |
| δCH3 | 1380 | Pointed peak |
Table 2: The characteristic absorption peak position of saturated alkane polymer composite materials.
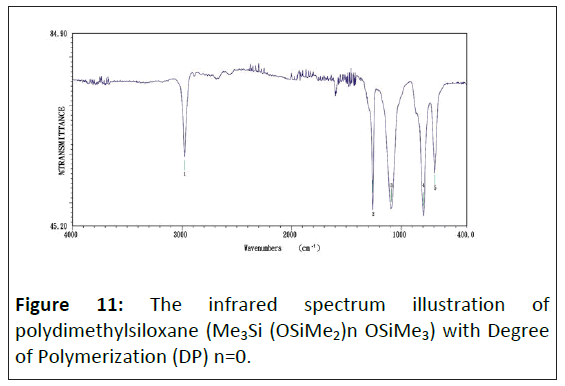
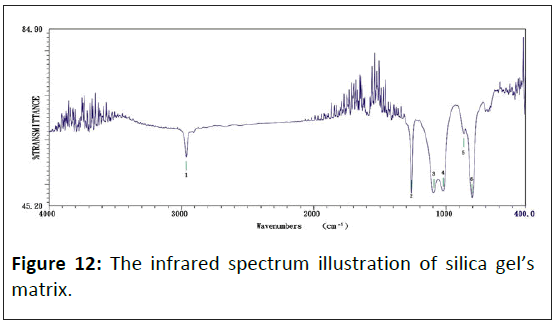
The infrared absorption spectrum of organic silicon polymer: Figure 11 shows this study about the infrared absorption spectrum of organic silicon polymer with phenyl. Figure 12 shows this study about the infrared absorption spectrum of silica gel's matrix. Figures 11 and 12 to acquire the influence of organic silicon polymer on infrared absorption strength. The chemical bond energy of organic silicon is more substantial than the C-H bond, many folds, and 5 times stronger than hydrocarbon. The infrared absorption spectrum of organic silicon polymer under the 1290 cm-1∼800 cm-1 spectrum range has a solid adsorb spectrum band. The characteristic absorption peak position of main functional groups is shown in Table 3.
| Cationic groups | Position of absorption peak/cm-1 | Characteristic of the absorption peak |
|---|---|---|
| Si-H | 2250∼2100 950∼800 |
The absorption of Si-H stretching vibration, strong The absorption of Si-H bent vibration, strong |
| Si-C | 890∼690 | The absorption of Si-C stretching vibration, strong |
| Si-CH3 | 1260 | The absorption of Si-CH3 methyl's deformed vibration, strong |
| C-H | 2960 | The absorption of C-H bond stretching vibration, weaker |
Table 3: The characteristic absorption peak's position of organic silicon polymer.
Figures 11 and 12 appear to have a strong absorb peak value near 1260 cm-1 the primary characteristic of Si-CH3 methyl's deformed vibration. The absorb peak value of 2960 cm-1 in Figures 11 and 12 is a C-H bond stretching vibration based on CH3.
Figure 12 displays the infrared absorption spectrum of silica gel that has six sets of absorb peak values, which wavenumbers separately show as: 1) 2964.05 cm-1, 2) 1261.22 cm-1, 3) 1095.37 cm-1, 4) 1022.09 cm-1, 5) 867.810 cm-1 and 6) 804.171 cm-1.
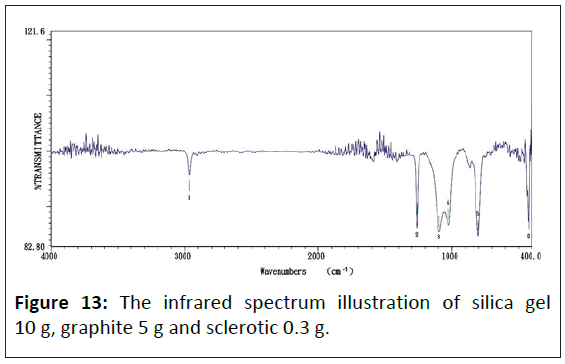
Figure 13 shows the infrared absorption spectrum of composite materials made from this study, which absorb peak values have six sets shown as: 1) 2964.05 cm-1, 2) 1261.22 cm-1, 3) 1095.37 cm-1, 4) 1025.94 cm-1, 5) 802.24 cm-1 and 6) 424.26 cm-1.
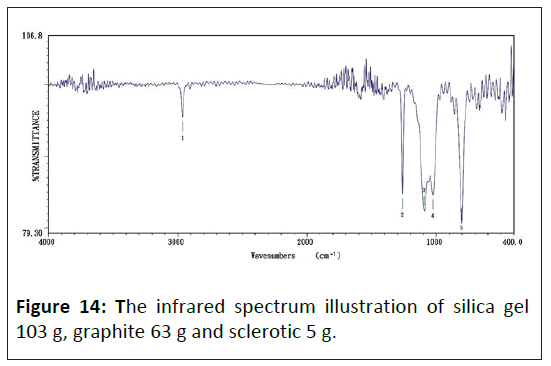
Figure 14 displays the infrared absorption spectrum of composite materials with more doping concentrations, which absorb peak values have five sets shown as: 1) 2964.05 cm-1, 2) 1261.22 cm-1, 3) 1093.44 cm-1, 4) 1025.94 cm-1, 5) 802.24 cm-1.
Consequently, doping a graphite particle in the composite, with electric conductivity increasing, makes the silica gel's original 867.81 cm-1 wave's adsorb peak value diminish gradually, but the 424.26 cm-1 wave's adsorb peak value increase.
The infrared spectra of silicon-oxygen bond (Si-O): According to Figure 11, the Si-O bond has a strong peak in zone 1100∼1000 cm-1, this peak coursing by the anti-symmetric extending vibration of the S-O-Si bond. To linear polysiloxane, with the growth of chain, the peak is divided into two similar intensity peaks, located at 1085 cm-1 and about 1020 cm-1. Cyclic polysiloxane is also absorbed in the same area. The Si-O band of trimeric ring siloxane (R2Si)3 shows an extension vibrating absorption peak at 1020 cm-1. The absorption peak of the tetramer or giant ring moved to 1090 cm-1. The substituents binding with silicon can also affect the position of the Si-O-Si bond absorption peak. For example, Cl3Si-O-SiCl3 and Si-OSi absorption are located at 1124 cm-1.
The infrared spectra of silica: Comparing Figures 11 and 14, the infrared spectra analysis of silica showed that although the silicon polymers doping with graphite, there are no Si-O and Si -C bonds. It suggests no chemical reaction between silicon and graphite particles; they are independent.
Results
Conductivity
For investigating the electrical characteristics of different concentrations, carbon was doped in silicon. Elastic polymers were produced by silica, which has high carbon absorbability, with varying concentrations of graphite doped. To further improve detection, other functionalities were employed to increase analyte binding [26].
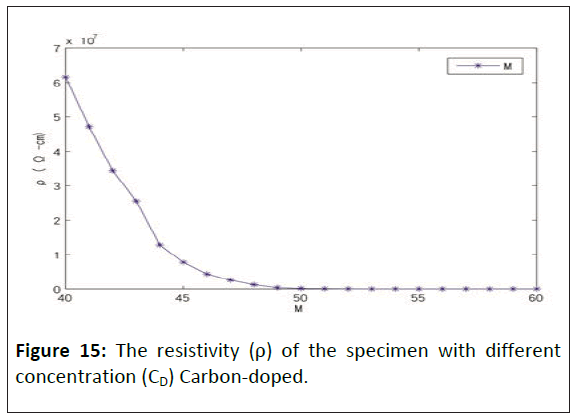
Figure 15 shows the resistivity (ρ) of a specimen with different concentrations (CD) of carbon-doped. The conductivity will increase rapidly when the elastic polymers contain 40 M graphite. When the elastic polymers contain 50 M graphite, the conductive becomes steady. When the elastic polymers contained 60 M graphite, graphite adsorption reached saturation. The flexibility of the polymer began to deteriorate, so the test materials had tiny cracks in the edge.
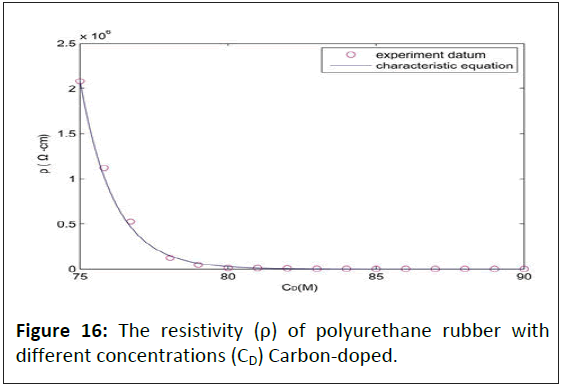
For investigating the adsorption and conductive of silicon, elastic polymers were produced by polyurethane rubber, which has high absorbability to carbon and no silicon contained, with different concentrations of graphite doped as control. Figure 16 shows polyurethane rubber's resistivity (ρ) with various concentrations (CD) of carbon doped. When the elastic polymers contained 75 M graphite, the conductivity of elastic polymers increased rapidly. When the graphite increases to 79 M, the conductivity of elastic polymers becomes steady. When the elastic polymers contained 90 M graphite, graphite adsorption reached saturation.
Resistance of temperature coefficient
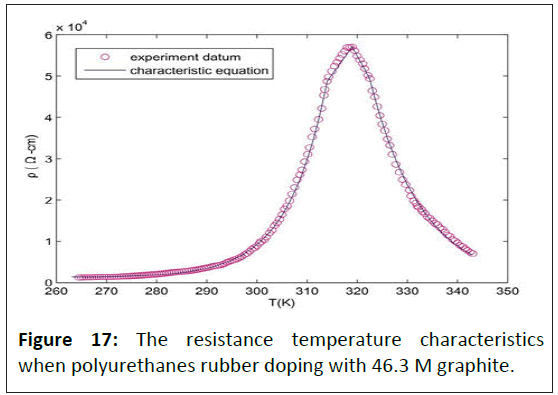
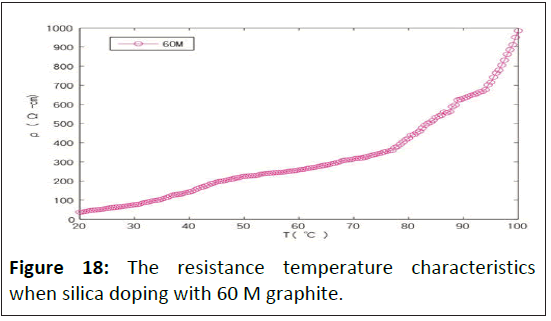
Theoretical studies have determined that the energy required for removing adsorbed particles from any interface is much greater than the energy required for spreading [27]. Physisorption is not a chemical reaction that needs no activation energy. Therefore, it can react easily and quickly to low temperatures. Molecular interactions between the free surface energy of interfacial adsorbed nanofibers and the substrate can dictate film morphology [28]. Adsorption is exothermic, so the resistance caused by the polymer's physisorption is proportional to temperature. The weak van der Waals force is the main force of physisorption. The physisorption is easily affected by temperature, so the temperature coefficient resistance varies greatly. Because the conductive of elastic polymers containing silicon has significant variances with the elastic polymers only, this study analyzed the resistance of temperature coefficient under similar resistivity but different concentrations of graphite doped. The result is as follows: When the polyurethane rubber is doping with 46.3 M graphite, the resistance temperature characteristics are shown in Figure 17; when the silica is doping with 60 M graphite, the resistance temperature characteristics are shown in Figure 18.
This experiment uses a nonelectrolyte solution that is not readily volatile. Only the solvent is volatile and there is no interaction between the solute and the solvent, which is close to an ideal solution and applicable to Raoult's law. According to Raoult's law, the total vapor pressure of a solution is equal to the sum of the vapor pressures of the solute and solvent. If two ideal solutions are mixed with a constant volume, they will not absorb or release thermal energy. Mixing two solutions and increasing their volume is an endothermic reaction. On the contrary, mixing two solutions reduces the volume, which is an exothermic reaction. Therefore, this experiment is an exothermic reaction.
Discussion
Conductivity
When doped 50 M graphite into elastic polymers containing 13.56% silicon, the physisorption made the elastic silicon polymers conductive. The resistivity of the elastic silicon polymers is 140 kΩ/cm, and its conductivity is 7.1428 μS/cm. Add the same concentration of graphite into the elastic polymers that contain no silicon, like polyurethane rubber. The resistivity of the polyurethane rubber is 60 kΩ/cm, and its conductivity is 0.01666 μS/cm. Dependent on the infrared absorption spectrum analysis, these two polymers were mainly composed of C-H bonds. The variance of conductive betweentwo polymers is 430 times only because of the chemical reaction of silicon particles.
Temperature coefficient
Adsorption of the chemisorptions is stronger than physisorption and is not easily affected by temperature. The elastic silicon polymers are working by physisorption, easily affected by temperature.
The characteristic equation of carbon concentration and resistance
Through several experiments, the characteristic equation of graphite concentration and resistance is as follows:

In Formula (3), C0 is the lowest doping concentration for using polymers as practicality resistance material; ρ0 is the resistivity of the lowest doping concentration; CC is the doping critical concentration of the steadying conducting state; CS is the doping saturation concentration of saturated adsorption; ρs is the resistivity of saturation concentration in saturated adsorption; Qm is the quality factor of material, which is dimensionless. The Qm of graphite is 4. When the temperature rises to 300 k, the C0 of polyurethanes rubber which is doping with graphite is 75 M, the C0 of silica is 45 M, the CC of polyurethanes rubber is 80 M, the CC of silica is 50 M, the CS of polyurethanes rubber is 90 M, the CS of silica is 60 M, the ρ0 of polyurethanes rubber is 2.08 × 10⁶ Ω/cm, the ρ0 of silica is 6.16 × 10⁷ Ω/cm, the ρs of polyurethanes rubber is 3.04 × 10² Ω/cm, the ρs of silica is 5.60 × 10² Ω/cm. When CD is smaller than CC, formula 3 can be simplified as follows formula 4:

The characteristic equation of resistance and temperature cofficient
Physisorption is not a chemical reaction that needs no activation energy; therefore, it can react easily and quickly at low temperatures. Adsorption is exothermic, so the resistance caused by the polymer's physisorption is proportional to temperature. The weak van der Waals force is the main force of physisorption. Conservation of energy dictates that electron transfer between an electrode and a redox system in solution or adsorbed on the electrode surface is fastest when the electron's energy is equal in the metal and the thermally activated redox system [29,30]. The physisorption is easily affected by temperature, so the temperature coefficient resistance varies greatly. When the polyurethanes rubber doping with 46.3 M graphite, the resistance temperature characteristics are shown in Figure 17. The characteristic equation of resistivity (ρ) and temperature as follows:

In Formula (5), T0 is the temperature of starting desorption; ρ0 is the resistivity at T0, Tpl is the starting temperature of positive temperature coefficient linear region, ρpl is the resistivity at Tpl, Tc is the critical temperature of positive and negative temperature coefficient of rubber polymers, ρC is the resistivity at TC, Tnl is the termination temperature of negative temperature coefficient linear region, ρnl is the resistivity at Tnl, Tm is the melt temperature of rubber polymers, ρm is the resistivity at Tm, Te is the environment temperature. QTd is the characteristic of material thermodynamics that is dimensionless. The QTd of graphite is 2. Dm is the characteristic of material desorption and is dimensionless. The Dm of graphite is 2. When polyurethanes rubber doping with 80 M graphite, the T0=267 K, Tpl=312 K, TC=319 K, Tnl=322.5 K, Tm=343 K, ρ0=1.296 × 10³ Ω/cm, ρpl=4.88 × 10⁴ Ω/cm, ρc=5.712 × 10⁴ Ω/cm, ρnl=4.936 × 10⁴ Ω/cm , ρm=7.04 × 10³ Ω/cm. The QTd of graphite is 2. Dm is the characteristic of material desorption and is dimensionless. The Dm of graphite is 2. When polyurethanes rubber doping with 80 M graphite, the T0=267 K, Tpl=312 K, TC=319 K, Tnl=322.5 K, Tm=343 K, ρ0=1.296 × 10³ Ω/cm, ρpl=4.88 × 10⁴ Ω/cm, ρc=5.712 × 10⁴ Ω/cm, ρnl=4.936 × 10⁴ Ω/cm , ρm=7.04 × 10³ Ω/cm.
When the silica is doping with 60 M graphite, the resistance temperature characteristics are shown in Figure 18. Linear segments can explain the relationship between resistivity (ρ) and temperature as piecewise linear equivalents. Because the linear is close to the actual curve, the characteristic equation is as follows:
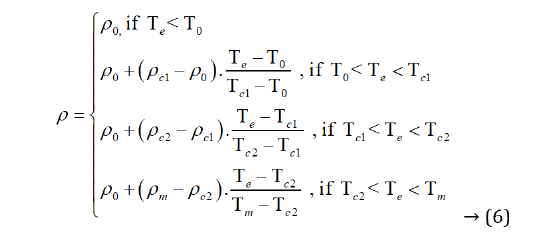
In Formula (6), T0 is the temperature of starting desorption; ρ0 is the resistivity at T0, Tcl is the first section critical temperature of positive temperature coefficient linear region, ρcl is the resistivity at Tcl, Tc2 is the second section critical temperature of positive temperature coefficient linear region of rubber polymers, ρc2 is the resistivity at Tc2, Tm is the melt temperature of rubber polymers, ρm is the resistivity at Tm, Te is the environment temperature. QTd is the characteristic of material thermodynamics that is dimensionless. The QTd of graphite is 2. Dm is the characteristic of material desorption and is dimensionless. The Dm of graphite is 2. When polyurethanes rubber doping with 60 M graphite, the T0 = 283 K, Tcl = 350.5 K, Tc2 = 368 K, Tm = 373 K, ρ0 = 1.83×101 Ω/cm, ρcl = 3.74×10² Ω-cm, ρc2 = 7.16×10² Ω/cm, ρm = 9.85× 10² Ω/cm.
The chemical bond of polymer includes silicon
The bond of silicone (Si-O): The Si-O is the main structure of saturated alkanes that make up polysiloxane rubber. It is the best essential chemical bond of organic silicon polymer. The bond energy of Si-O is great and reaches 451 kJ/mol; therefore, its bond is stable. The bond length of Si-O is longer, and its bond angle is bigger. Therefore, it became easy to rotate between Si- O and which steric is little when turning around Si-O's side group. The main structure of Si-O is spiral, which has a very soft physical character. The difference in electronegativity between Si and O is great, reaching 1.7. Especially under high temperatures, it can still be interrupted. When temperature exceeds 473 K, fewer polarity matters can slowly lead to the Si-O dissociation. The 3d anti-bonding of Si with oxygen can form a coordinate bond of dπ-pπ. The alkalinity of oxygen on Si-O is lower than the C-O ether bond.
The bond of silicon carbide (Si-C): The Si-C is the side group that makes up polysiloxane rubber. It gives the organic nature of the polysiloxane rubber. The bond energy and bond length of Si-C are relative to the side group's length. When the side group is methyl, the bond energy is greater and about 368 kJ/mol; for this reason, the polysiloxane rubber has superior chemical stability. If the side group is ethyl or its length is longer, Si-C's strength weakens (ethyl, butyl individual equal to 276 kJ/mol and 217 kJ/mol) and is easy to oxidize. The bond length of Si-C is longer, which is equal to 0.188 nm. Methyl can encircle Si-C's axis, rotate unboundedly, and proceed under 78 K temperature. The bond of Si-C has polarity and, therefore, can be cut off by strong acids or alkali. It is especially easy to cut off when Si is linked with vinyl or aromaticity. Because the bond length of Si-C is longer, the P electron contact is hard between Si and C. It makes the Si-C's double bond unstable and hard to form.
Silicon atomic structure affects the adsorption conductive of elastic polymers
Silicon and carbon are located in the same periodic table family; their atomic structure and properties are similar. However, silicon in the third period in the 14th periodic table family and carbon in the second period also have many differences. The atomic radius of silicon is 0.11 nm; the volume of silicon is 1.5 times bigger than carbon, so the spacing between silicon and substituent is longer than carbon. For example, the distance between each chlorine atom within SiCl4 is 0.329 nm, and between each chlorine atom within CCl4 is 0.298 nm. Thus, silicon atoms have a poor shielding effect. Therefore, the silicon-containing polymers are much easier to hydrolyze than the polymer carbon.
Adsorption is facilitated by hydrophobic π–π interactions [31]. The silicon atoms are part of a silacyclopentadiene unit responsible for the unique σ*–π/π* conjugation that defines their reduced band gap energies [32,33]. Silicon and carbon are reduced π electron shells with the same physisorption, making the elastic polymers conductive. Therefore, when adding 50 M graphite, the conductive can vary 430-fold between the elastic polymer containing 13.56% silicon and non-silicon. This huge variance of conductive is because the electronic structure of silicon has 3s2 3p2 and 3d empty orbital. The 3d electron shell structure can have an empty orbital, producing a dπ-pπ bond with quasimetallic characteristics. A carbon atom has no d electrons and no coordination, so when carbon and silicon are put into the elastic polymers; they will adsorb and conduct together, creating a better conductivity.
To compare the electron shell's silicon structure with carbon, which can realize those outer have four electrons, both tetrad. The silicon atom's radius is greater than carbon, but its electronegativity is smaller than carbon. The silicon atom's valence electrons lie in electrons orbits far from the atom nucleus and towards electropositivity. The silicon atom's valence electrons also have 3d anti-bonding that extends the valence bond and makes it apt to react.
The silicon atom usually combines with other atoms by sp3 hybrid orbitals and forms the hybrid orbitals of sp3d (trigonal bipyramid, square pyramid) and sp3d2 (octahedron); hence, it can generate quinquevalent even hexavalent's coordination compounds. Furthermore, silicon atoms with other element atoms can form a coordinate bond of dπ-pπ. The coordinate bond of dπ-pπ comes into being when an atom combines with silicon or the p electron of the atomic group enters silicon 3d anti-bonding. It makes the bond between silicon and the atomic group have an original character of a single bond and a partial character of a double bond, increasing the electric conductivity.
The characteristics of electricity and infrared absorption spectrum
By experimenting to acquire when raising the concentration of dopant which can increase the element's physisorption and restrain the variations of electric dipole moment when the element vibrates, which makes the infrared absorption spectrum weak or disappear. Because some baseband has physisorption, which increases the symmetry, it results in degeneration. For example, the cationic methyl group (-CH3) has double degeneracy. Owing to the decrease in degeneration, the adsorb peak value increases electric conductivity. Furthermore, increasing the carbon concentration of dopant to macromolecule composite materials can increase electric conductivity and melting point.
This study discovers that the physisorption of elastic polymer composite materials only relies on the van der Waals' force. Compared with chemical bonds, the van der Waals force is weaker and less selective. In didn't create any chemical bond circumstances, elastic polymer composite materials can generate a unique absorption spectrum.
Conclusions
According to experiments and the derivation of characteristic equations, different elastic polymers, containing silicon or not, will not affect the characteristic equation of graphite concentration and resistance but only change the equivalent value. Therefore, more diversity experiments are needed to test whether or not the characteristic equation applies to most of the polymers. Physisorption can form a single or multiple molecules adsorbed layer, multiple molecules adsorbed layer at the most. Macromolecules and carbon are multiple molecules in the adsorbed layer; their adsorption rate and rate are very quick. Therefore, it can reduce the process and production costs.
Compare the infrared absorption spectrum with the doping concentration of carbon to achieve the doping concentration of carbon, which is characteristic of physisorption, changes the atom's energy gap and makes the composite materials have electric conductivity. The characteristic of physisorption also changes the infrared absorption spectrum. Experimenting to acquire the physisorption affects fingerprint area greatest. In the infrared absorption spectrum, the wavenumbers between 1500 m-1 to 600 cm-1, referred to as fingerprint area, are closely linked to all molecule's structure, which can be used to distinguish between two compounds whether the same or not.
Physisorption relies on the relatively weak and non-selection of van der Waals' forces. Under didn't the chemical bond situation, it produces chemical bonds with a particular absorption spectrum and produces electric conductivity. That is the most special theory about the physisorption effect on the infrared absorption spectrum.
References
- Guimard NK, Gomez N, Schmidt CE (2007) Conducting polymers in biomedical engineering. Prog Polym Sci 32: 876-921.
[Crossref], [Google Scholar]
- Bravo-Grimaldo E, Hachey S, Cameron CG, Freund MS (2007) Metastable reaction mixtures for the in situ polymerization of conducting polymers. Macromolecules 40: 7166-7170.
[Crossref] [Google Scholar] [Indexed]
- Zhou Y, Zhang F, Tvingstedt K, Barrau S, Li F, et al. (2008) Investigation on polymer anode design for flexible polymer solar cells. Appl Phys Lett 92: 233308.
[Crossref] [Google Scholar] [Indexed]
- Zaumseil J, Friend RH, Sirringhaus H (2006) Spatial control of the recombination zone in an ambipolar light-emitting organic transistor. Nature Materials 5: 69-74.
[Crossref] [Google Scholar] [Indexed]
- D'Arcy JM, Tran HD, Tung VC, Tucker-Schwartza AK, Wonga RP, et al. (2010) Versatile solution for growing thin films of conducting polymers. Proc Natl Acad Sci USA 107: 19673-19678.
[Crossref] [Google Scholar] [Indexed]
- Yun YH, Lee BK, Choi JS, Kim S, Yoo B, et al. (2011) A glucose sensor fabricated by piezoelectric inkjet printing of conducting polymers and bienzymes. Anal Sci 27: 375.
[Crossref] [Google Scholar] [Indexed]
- Rouquerol F, Rouquerol J, Sing KSW, Llewellyn P, Maurin G (1999) Adsorption by powders and porous solids. 2nd Edition. Elsevier, San Diego, USA.
- Li D, Kaner RB (2005) Processable stabilizer-free polyaniline nanofiber aqueous colloids. Chem Commun 26: 3286-3288.
- Chaudhury MK, Whitesides GM (1991) Direct measurement of interfacial interactions between semispherical lenses and flat sheets of poly (dimethylsiloxane) and their chemical derivatives. Langmuir 7: 1013.
[Crossref] [Google Scholar] [Indexed]
- Ghanbari H, Mel AD, Seifalian AM (2011) Cardiovascular application of polyhedral oligomeric silsesquioxane nanomaterials: A glimpse into prospective horizons. Int J Nanomedicine 6: 775-786.
[Crossref] [Google Scholar] [Indexed]
- Kannan RY, Salacinski HJ, Edirisinghe MJ, Hamilton G, Seifalian AM (2006) Polyhedral oligomeric silsequioxane-polyurethane nanocomposite microvessels for an artificial capillary bed. Biomaterials 27: 4618-4626.
[Crossref], [Google Scholar], [Indexed]
- Li GZ, Yamamoto T, Nozaki K, Hikosaka M (2001) Crystallization of ladder-like Poly Phenyl Silsesquioxane (PPSQ)/isotactic Polystyrene (i-PS) blends. Polymer 42: 8435-8441.
[Crossref], [Google Scholar]
- Maciel GE, Sullivan MJ, Sindorf DW (1981) Carbon-13 and silicon-29 nuclear magnetic resonance spectra of solid poly (methylsiloxane) polymers. Macromolecules 14: 1607-1608.
[Crossref], [Google Scholar]
- Frye CL, Collins WT (1970) Oligomeric silsequioxanes, (HSiO3/2)N. J Am Chem Soc 92: 5586-5588.
[Crossref], [Google Scholar].
- Magnus P (2000) Silicon in organic, organometallic and polymer chemistry. ACS Publications, Newyork, USA.
- Denmark SE (2009) The interplay of invention, discovery, development and application in organic synthetic methodology: A case study. J Org Chem 74: 2915-2927.
[Crossref], [Google Scholar], [Indexed]
- Denmark SE, Tymonko SA (2003) Cross-coupling of alkynylsilanols with aryl halides promoted by potassium trimethylsilanolate. J Org Chem 70: 9151-9154.
[Crossref], [Google Scholar], [Indexed].
- Lee M, Ko S, Chang S (2000) Highly selective and practical hydrolytic oxidation of organosilanes to silanols catalyzed by a ruthenium complex. J Am Chem Soc 122: 12011-12012.
[Crossref], [Google Scholar].
- Ojima I, Li Z, Zhu J (1998) The chemistry of organic silicon compounds. Rappoport Z, Apeloig Y. John Wiley and Sons, New Jersey, USA.
- Denmark SE, Kallemeyn JM (2003) Palladium-catalyzed silylation of aryl bromides leading to functionalized aryldimethylsilanols. Org Lett 5: 3483-3486.
[Crossref], [Google Scholar], [Indexed]
- Lickiss PD (1995) The synthesis and structure of organosilanolsInorg. Chem 42: 147-262.
[Crossref], [Google scholar].
- Tsai TH, Wang CY (2023) A study of ammonium bifluoride as an agent for cleaning silicon contamination in the wafer dicing process. App Sci 13: 5294.
[Crossref], [Google Scholar]
- Tsai TH, Wang CY (2023) Metal corrosion protection in ammonium bifluoride-base cleaning agent for Si contaminants aspects in mining and mineral science. 11: 000767.
[Crossref]
- Tsai TH, Wang CY (2023) A new quick sieve method for etchant evaluation and ubm Cu undercut improvement. Am J Biomed Sci 19: 783–790.
[Crossref]
- Jager EWH, Smela E, Inganas O (2000) Microfabricating conjugated polymer actuators. Science 290: 1540–1545.
[Crossref], [Google Scholar], [Indexed]
- Amara JP, Swager TM (2005) Synthesis and properties of poly(phenylene ethynylene)s with pendant hexafluoro-2-propanol groups. Macromolecules 38: 9091–9094.
[Crossref], [Google Scholar]
- Ata S (2008) Coalescence of bubbles covered by particles. Langmuir 24: 6085–6091.
[Crossref], [Google Scholar], [Indexed]
- Bestehorn M, Pototsky A, Thiele U (2003) 3d large scale Marangoni convection in liquid films. Eur Phys J B 33: 457–467.
[Crossref], [Google Scholar]
- Iwasita T, Schmickler W, Schultze JW (1985) The influence of the metal on the kinetics of outer sphere redox reactions. Ber Bunsenges Phys Chem 89: 138–142.
[Crossref], [Google Scholar]
- Royea WJ, Hamann TW, Brunschwig BS, Lewis NS (2006) A comparison between interfacial electron-transfer rate constants at metallic and graphite electrodes. J Phys Chem B 110: 19433–19442.
[Crossref], [Google Scholar], [Indexed]
- Sanchez JC, DiPasquale AG, Mrse AA, Trogler WC (2009) Lewis acid–base interactions enhance explosives sensing in silacycle polymers. Anal Bioanal Chem 395: 387–392.
[Crossref]
- Yamaguchi S, Tamao K (1996) Theoretical study of the electronic structure of 2,2'-bisilole in comparison with 1,1'-Bi-1,3-cyclopentadiene: σ*–π* conjugation and a low-lying LUMO as the origin of the unusual optical properties of 3,3',4,4'-tetraphenyl-2,2'-bisilole. Bull Chem Soc Jpn 69: 2327–2334.
[Crossref], [Google Scholar]
- Yamaguchi Y (1996) Design of novel σ*-π* conjugated polysilanes. Synth Met 82: 149–153.
[Crossref], [Google Scholar]
Open Access Journals
- Aquaculture & Veterinary Science
- Chemistry & Chemical Sciences
- Clinical Sciences
- Engineering
- General Science
- Genetics & Molecular Biology
- Health Care & Nursing
- Immunology & Microbiology
- Materials Science
- Mathematics & Physics
- Medical Sciences
- Neurology & Psychiatry
- Oncology & Cancer Science
- Pharmaceutical Sciences
