Validating the Percentage Depth Doses Using Two Different Phantom Materials
Keolathile Diteko, Thokozani Dudley Mkhize and Mohlapoli Stadium Mohlapholi
Keolathile Diteko1,2,3*, Thokozani Dudley Mkhize2,3 and Mohlapoli Stadium Mohlapholi2,3
1International Atomic Energy Agency (IAEA) Fellow, University of Stellenbosch, South Africa
2Division of Medical Physics, Stellenbosch University, Stellenbosch, South Africa
3Division of Medical Physics, Tygerberg Hospital, Cape Town, South Africa
- *Corresponding Author:
- Keolathile Diteko
Interntional Atomic Energy Agency (IAEA) Fellow
University of Stellenbosch, South Africa
Tel: 26772301684
E-mail: ditytso@hotmail.com
Received Date: June 18, 2020; Accepted Date: July 2, 2020; Published Date: July 9, 2020
Citation: Diteko K, Mkhize TD, Mohlapholi MS (2020) Validating the Percentage Depth Doses using Two Different Phantom Materials. Insights Med Phys.Vol.5 No.1:7. DOI: 10.36648/2574-285X.5.1.7
Copyright: © 2020 Diteko K, et al. This is an open-access article distributed under the terms of the Creative Commons Attribution License, which permits unrestricted use, distribution, and reproduction in any medium, provided the original author and source are credited.
Abstract
Introduction: Percentage depth dose (PDD) is important for absolute dose measurements in external beam radiotherapy machines. Solid water has a density close to water. International Atomic Energy Agency (IAEA) TRS 398 protocol recommends water for absolute dosimetry measurements.
Aim: To conduct a quick PDD check using solid water without setting up a water tank for 6MV, 8 MV and 18 MV photon beam energies.
Materials and methods: RM457 solid water phantom, IBA Blue phantom2 water tank, PTW 30013 Farmer chamber (0.6 cc), IBA scanning chamber CC04, IBA Omnipro Accept 7.4b software, PTW UNIDOS E Electrometer, ELEKTA Synergy platform.
Set-up: 100 cm SSD, 10 × 10 cm2 field size, 100 MU.
Results: Higher % difference observed for the build-up regions in ranges of; 6 MV: -4.3% to -1.1%; 8 MV: -5.6% to -1.6% and 18 MV: -8.1% to -1.3%. Zmax values shifted by ± 2 mm from the water phantom data.
Dose fall-off region-values were in agreement (within ± 1%) except for 6 MV at 20 cm, which was -1.2%.
Conclusion: The proposed method can be used as a practical recommendation for a quick dosimetric reference check for PDDs.
Keywords
Percentage depth dose; Ionisation chamber; RMI 457 solid water phantom; Tissue equivalent phantom; water equivalent phantom; Dose normalization; Effective point of measurement; Perturbation factor; Cavity theory; Tissue phantom ratio; Beam quality factor
Introduction
Radiation therapy as a well-established cancer treatment method requires accurate dose computation in the Radiotherapy Treatment Plan (RTP). Accurate dose delivery in radiotherapy is important for the expected positive outcome in patients. The absorbed dose to water for beam quality Q (Dw,Q) at a reference point in a phantom is a vital parameter for planning the treatment Monitor Units (MU). According to the International Atomic Energy Agency, Technical Report Series – 398. (IAEA TRS 398), code of practice protocol, absolute dosimetry is performed using a water phantom, a calibrated ionisation chamber and an electrometer. Radiation therapy’s success during acceptance testing, commissioning and quality assurance of linear accelerators lies in accurate collection of data which includes; percentage depth doses (PDDs), beam profiles, output factors using various field sizes and other dosimetric parameters [1-3].
Percentage Depth Dose (PDD)
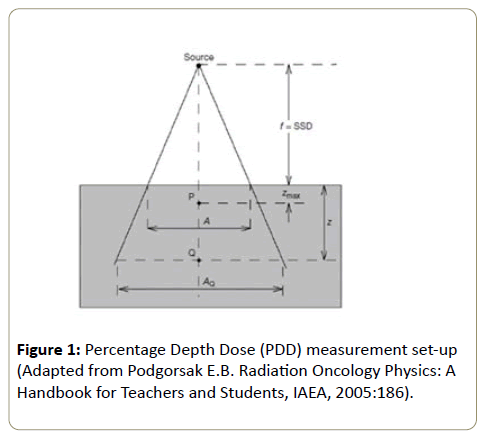
Dose inside a phantom or a patient is normalised to maximum dose (Dmax) at maximum depth (Zmax) or (dmax) and this is referred to as Percentage Depth Dose (PDD) distribution. PDDs, beam profiles and output characterisation of different field sizes are some of the dosimetric data necessary to validate the Treatment Planning System (TPS) used to select optimal radiation modality and treatment technique for individual patients. Hence this data is useful in acceptance testing and commissioning of a linear accelerators for clinical use. PDD is dependent on the beam energy (hv), field size (A), Source to Surface Distance (SSD), the depth of measurement (Z) and in homogeneity (Figure 1).
Percentage depth dose (PDD) is then calculated using;

Where DQ is absorbed dose at any measured point Q, DP is absorbed dose at reference point P, Zmax (also dmax) is maximum depth [3-5].
Tissue-equivalent/water-equivalent phantoms
Tissue-equivalent/water-equivalent solid phantoms have been accepted for dosimetric measurements as they are quick to set-up and are robust. These phantoms are used as they have properties close to those of water. These properties include; physical density (ρ), relative electron density (ρe), atomic number, radiation absorption and scattering characteristics. Megavoltage radiotherapy beams apply the Compton Effect as the dominant interaction process and Compton effect is dependent on the electron density. Tissue/water-equivalent phantoms should not replace water in absolute dose measurements as recommended by IAEA TRS 398 [6,7]. The RMI 457 solid water phantom has the following characteristics compared to water; Physical density, ρ, (gcm-3); RMI457=1.030 and water=1.000; Electron density, ρe, RMI 457=3.388 × 10²³ and water=3.343 × 10²³ [8,9].
Effective point of measurement (EPOM)
IAEA TRS 398 protocol suggests that PDD measurements be conducted at the EPOM of the cylindrical ion chamber. Ionisation chambers used in dose measurements displaces some volume of the phantom medium. The cavity theory suggests that the ion chamber walls be water equivalent and even so, the volume occupied by the air cavity affects the electron fluence. The chamber reading will then be affected by the missing medium hence measurements should be corrected with a factor known as perturbation factor (Pdis) or using the EPOM normally less than unity. The perturbation factor (Pdis) depends on radiation quality, physical dimensions of the air cavity and the depth of measurement. The initial zero depth of measurement is temporarily set with the EPOM at the water surface. Measurements are then conducted by moving the ionisation chamber towards the radiation source by 0.6r for photon beams, where, r is the internal radius of the cylindrical ion chamber [3,4,10].
Purpose
The purpose of the study was to perform dose measurements on RMI 457 solid water phantom and compare it to absolute dosimetry PDD data of a water phantom, using an ELEKTA Synergy platform linear accelerator at Tygerberg Hospital, South Africa. The solid water dose measurements would be useful for verification and quality assurance purposes in cases of a malfunctioning water tank mechanism due to mechanical breakdown (wear and tear) as well as faulty electronics.
Aim
To conduct a quick PDD check using RMI 457 solid water without setting up a water tank for 6 MV, 8 MV and 18 MV photon beam energies.
Materials and Methods
ELEKTA Synergy platform
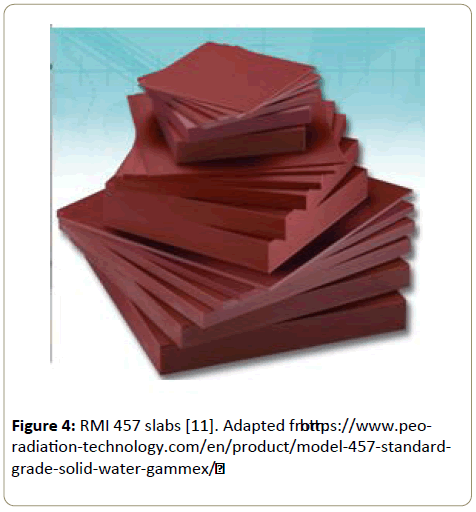
RMI 457 solid water (30 × 30 cm2 slabs of different thickness from 0.2 cm to 5.0 cm)
IBA Blue phantom2 water tank
PTW 30013 Farmer chamber (0.6cc)
IBA scanning chambers (CC04)
Omnipro Accept 7.4b software
PTW UNIDOS E Electrometer
Spirit level
Set-up
100 cm SSD
10 × 10 cm2 field size
100 MU
Water phantom measurements
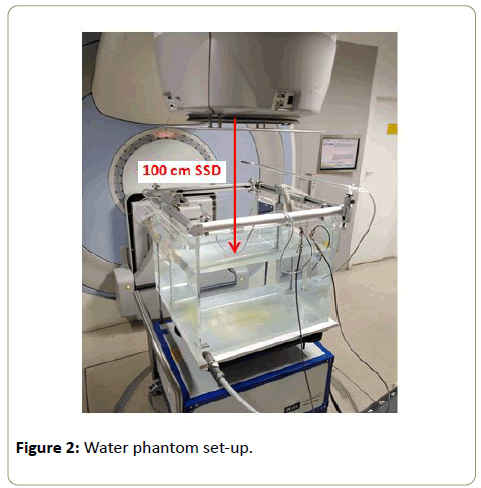
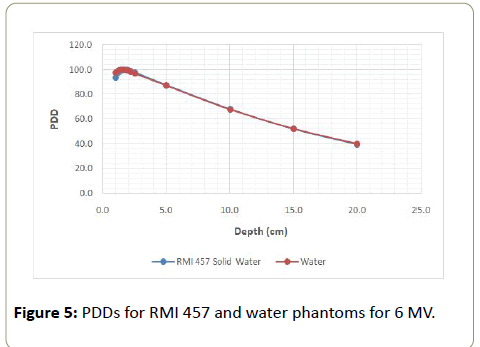
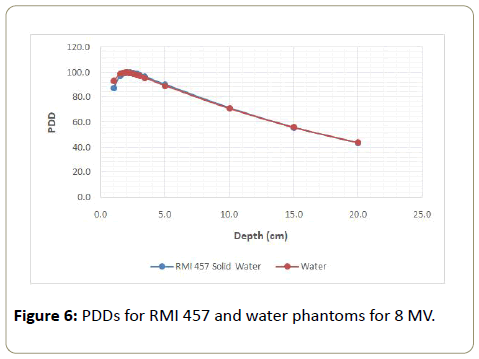
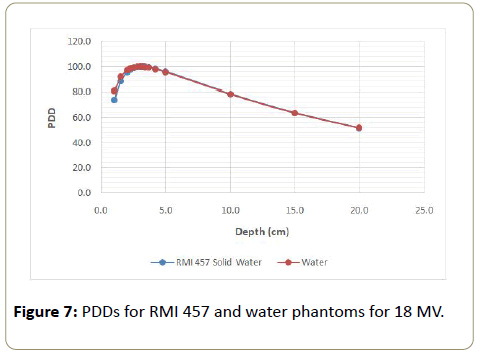
Absolute dosimetry PDD data for the ELEKTA Synergy platform was used in this study. The PDD was measured in a 3D computer-controlled IBA Blue phantom2 water tank following IAEA TRS-398 code of conduct protocol for photon beam energies of 6 MV, 8 MV and l8 MV in a field size of 10 × 10 cm2. The water phantom was centered under the radiation field and levelled using a spirit level before measurements were conducted. The ion chambers used in this case were the IBA scanning chambers (CC04), with one chamber in the water phantom and the other (reference chamber) in air but at the corner of the radiation field (Figure 2). Continuous scanning was used for measurements along the central axis (CAX) from bottom to top of the water phantom to avoid water ripples at the surface which might result in a noisier signal thus affecting the PDD curve. Omnipro Accept 7.4b scanning software was set to automatically move the ion chamber to the EPOM. PDD values corresponding to solid water measurement depths were extracted from the plotted PDD and recorded in Tables 1, 2 and 3 below.
| Depth (cm) | RMI 457 Solid water | Water | % difference |
|---|---|---|---|
| 1.0 | 93.8 | 97.5 | -3.9 |
| 1.2 | 97.6 | 99.2 | -1.6 |
| 1.4 | 99.4 | 100 | -0.6 |
| 1.5 | 99.6 | 99.9 | -0.3 |
| 1.7 | 100 | 99.7 | 0.3 |
| 1.9 | 99.8 | 99.3 | 0.5 |
| 2.0 | 99.5 | 99.3 | 0.2 |
| 2.2 | 98.9 | 98.3 | 0.7 |
| 2.5 | 97.9 | 96.9 | 1.0 |
| 5.0 | 87.5 | 87.0 | 0.6 |
| 10.0 | 68.1 | 67.7 | 0.6 |
| 15.0 | 51.8 | 52 | -0.4 |
| 20.0 | 39.4 | 39.9 | -1.2 |
Table 1: RMI 457 solid water and water PDD values for 6 MV photon energy beam.
| Depth (cm) | RMI 457 Solid water | Water | % difference |
|---|---|---|---|
| 1.0 | 87.5 | 92.7 | -5.6 |
| 1.5 | 97.1 | 98.6 | -1.6 |
| 1.7 | 98.9 | 99.6 | -0.7 |
| 1.9 | 99.7 | 100 | -0.3 |
| 2.0 | 99.8 | 99.7 | 0.1 |
| 2.2 | 100 | 99.6 | 0.4 |
| 2.3 | 99.9 | 99.4 | 0.5 |
| 2.5 | 99.5 | 98.9 | 0.6 |
| 2.8 | 98.6 | 97.7 | 1.0 |
| 3.0 | 97.8 | 96.9 | 1.0 |
| 3.4 | 96.4 | 95.6 | 0.9 |
| 5.0 | 90.1 | 89.2 | 1.0 |
| 10.0 | 71.4 | 71.0 | 0.7 |
| 15.0 | 55.7 | 55.9 | -0.2 |
| 20.0 | 43.4 | 43.7 | -0.6 |
Table 2: RMI 457 solid water and water PDD values for 8 MV photon energy beam.
| Depth (cm) | RMI 457 Solid water | Water | % difference |
|---|---|---|---|
| 1 | 74.2 | 81.0 | -8.4 |
| 1.5 | 88.2 | 91.6 | -3.7 |
| 2 | 95.5 | 97.1 | -1.6 |
| 2.2 | 97.4 | 98.2 | -0.8 |
| 2.3 | 97.9 | 98.8 | -0.9 |
| 2.5 | 98.8 | 99.3 | -0.5 |
| 2.8 | 99.7 | 99.9 | -0.2 |
| 3 | 99.8 | 99.9 | -0.1 |
| 3.2 | 100 | 99.7 | 0.3 |
| 3.3 | 100 | 99.6 | 0.4 |
| 3.4 | 99.9 | 99.6 | 0.4 |
| 3.7 | 99.5 | 99.3 | 0.2 |
| 4.2 | 98.2 | 97.8 | 0.4 |
| 5 | 95.7 | 95.3 | 0.5 |
| 10 | 78.5 | 78.4 | 0.2 |
| 15 | 63.6 | 63.6 | 0.0 |
| 20 | 51.4 | 51.7 | -0.6 |
Table 3: RMI 457 solid water and water PDD values for 18 MV photon energy beam.
RMI 457 solid water phantom measurements
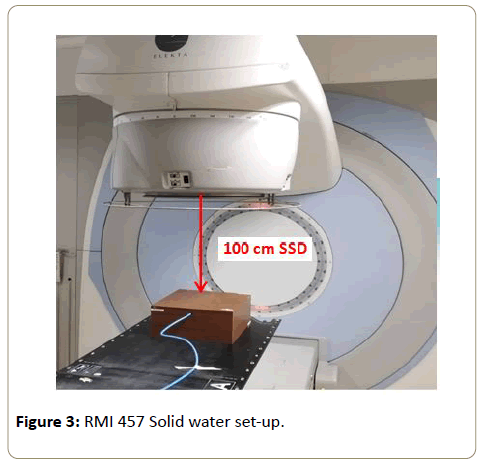
Point dose measurements were conducted on RMI 457 solid water phantom for the 6 MV, 8 MV and 18 MV photon beam energies. A 10 cm solid water slab was placed under the slab with the ion chamber inlet for backscatter (Figure 3). The solid water phantom was aligned to the center of the 10 × 10 cm2 field size using line markings on the 2 cm slab with a hole. A PTW 30013 Farmer chamber (0.6 cc) was placed in the cavity of the 2 cm solid water slab and left for 10 minutes to reach equilibrium temperature. Other depth measurements were achieved by stacking slabs of different thickness on top of the 2 cm slab with the farmer chamber, while always maintaining the 100 cm SSD, 100 MU and the 10 cm solid water slab under the ion chamber. Two (2) dose measurements were conducted for each depth and an average value recorded. PDDs values were then calculated using equation 1 above and tabulated in Tables 1, 2 and 3 below.
Results and Analysis
The average dose measurements for the solid water phantom were normalised to the measured Dmax of each beam energy (Equation 1). The normalised solid water PDDs were plotted together with water PDD for comparison. Normalised solid water PDD values were then multiplied by the solid water to liquid water conversion factor, kQS,W to get corrected solid water PDD valuesat only 10 cm and 20 cm depths for the calculation of PDD20,10. The was calculated using equation 2 below;
The was calculated using equation 2 below;

Where Dw(Zw,r) is absorbed dose in water at depth Zw and Ds(Zeq,r) is absorbed dose in the RMI 457 solid water phantom at an equivalent depth Zeq [5,8].
Zmax values were extrapolated from Figures 3-7 then recorded in Table 4 below in order to evaluate the RMI 457 Zmax shift (difference) from absolute dosimetry PDD data. These values were recorded in Table 4 below.
| Energy (MV) |
Zmax (cm) | ||
|---|---|---|---|
| RMI 457 | Water | Difference (cm) | |
| 6 | 1.70 | 1.51 | 0.19 |
| 8 | 2.20 | 2.00 | 0.20 |
| 18 | 3.20 | 3.00 | 0.20 |
Table 4: Zmax values for 6 MV, 8 MV and 18 MV photon beam energies.
Figure 4: RMI 457 slabs [11]. Adapted from: https://www.peo-radiation-technology.com/en/product/model-457-standard-grade-solid-water-gammex/
A previous study by Duprez et al. presented depth dose conversion factors for RMI 457 solid water to water for the same ELEKTA Synergy platform at Tygerberg Hospital, South Africa (Table 5).
| Energy (MV) |
kQs,w values | |
|---|---|---|
| 10 cm | 20 cm | |
| 6 | 0.995 | 1.000 |
| 8 | 0.996 | 0.999 |
| 18 | 1.004 | 1.004 |
Table 5: Solid water- water conversion factors KQS,W for depth of 10 cm and 20 cm for a 10 × 10 cm2 field size.
Adapted with permission from Duprez et al (2018).
The kQS,Wvalues (Table 5) were then used to multiply measurements at 10 cm and 20 cm depths for calculation of solid water PDD20,10 and the results were tabulated in Table 6.
| Energy (MV) |
PDD20,10 | ||
|---|---|---|---|
| RMI 457 | Water | % difference | |
| 6 | 0.582 | 0.590 | -1.4 |
| 8 | 0.610 | 0.616 | -1.0 |
| 18 | 0.654 | 0.659 | -0.8 |
Table 6: PDD20,10 for solid water and water phantoms for a 10 × 10 cm2 field size.

PDD20,10 values for both phantoms were used to calculated the tissue-phantom ratio (TPR20,10).
TPR(20,10) = 1.2661 PDD(20,10)-0.0595 (4)
TPR20,10 values were recorded in Table 7 below.
| Energy (MV) |
TPR20,10 | ||
|---|---|---|---|
| RMI 457 | Water | % difference | |
| 6 | 0.678 | 0.687 | -1.3 |
| 8 | 0.713 | 0.720 | -1.0 |
| 18 | 0.769 | 0.775 | -0.8 |
Table 7: TPR20,10 for both phantoms for a 10 × 10 cm2 field size.
The calculated TPR20,10 values are useful in finding the beam quality factor (KQ) from published tables. The KQ factor is needed for calculation of dose at any point in the phantom.
Discussion
Higher % difference were observed in the Build-up regions; 6 MV: -4.3% to -1.1%; 8 MV: -5.6% to -1.6% and 18 MV: -8.1% to -1.3%. RMI 457, Zmax values shifted by ± 2 mm form the water phantom data and this could be due to the phantom scatter factor and the chamber volume effect. Dose fall-off region values were in agreement (within ± 1%) except for 6 MV at 20 cm which was -1.2%. Dose fall off region values are within the 1 mm/1% tolerance recommended by IAEA TRS-398.
Conclusion
The proposed method can be used as a practical recommendation for a quick dosimetric reference check for PDDs, in a resource strapped hospital where a physicist can be able to perform measurements safely within good agreement with TRS 398.
References
- Sardari D, Maleki R, Samavat H,EsmaeeliA(2010) Measurement of depth-dose of linear accelerator and simulation by use of Geant4 computer code. Rep PractOncolradiother15(3):64-68.
- Ravichandran R, Binukumar JP, Davis CA (2013) Estimation of absorbed dose in clinical radiotherapy linear accelerator beams: Effect of ion chamber calibration and long-term stability. J med Phys38(4):205-209.
- IAEA (2006) Absorbed Dose determination in External Beam Radiotherapy: An International Code of Practice for Dosimetry based on Standards of Absorbed Dose to Water. IAEA Technical Report Series p:398.
- Sruti RN, Islam MM, Rana MM, Bhuiyan MMH, Khan KA, et al. (2015) Measurement of Percentage Depth Dose of a Linear Accelerator for 6 MV and 10 MV Photon Energies. Nuclear Science and Applications. 24:29-32.
- Podgorsak EB. Radiation Oncology Physics: A handbook for Teachers and Students. IAEA. 2005.
- Ramaseshan R, Kohli K, Cao F, Heaton R (2008) Dosimetric Evaluation of Plastic Water Diagnostic Therapy. J App CliniPhys 9(2):98-111.
- Hill RF, Brown S, Baldock C(2008) Evaluation of the water equivalence of solid phantoms using gamma ray transmission measurements. ELSIVIER-Relative Measurements 43:1258-1264.
- Duprez DRR, Van Reenen CJ, Mkhize TD, Mohalpholi MS, Du Toit M.D, et al. Evaluation of the Dosimetric Equivalence of RMI 457 Solid Water in the Context of Absorbed Dose Protocols. Poster Presented in 2018 at University of Stellenbosch. South Africa.
- Hong JW, Lee HK, Cho JH(2015) Comparison of the Photon Charge Between water and Solid Phantom depending on Depth. Int J Rad Res 13(3): 229-234.
- Seif F, Karbalayi M, Bayatiani MR, Karbalayi M, Tahmasebi-Birgain MJ (2013) Effective point of Measurement in Cylindrical Ion Chamber for Megavoltage Photons Beams. Iranian J Med Phys10(3): 147-155.
Open Access Journals
- Aquaculture & Veterinary Science
- Chemistry & Chemical Sciences
- Clinical Sciences
- Engineering
- General Science
- Genetics & Molecular Biology
- Health Care & Nursing
- Immunology & Microbiology
- Materials Science
- Mathematics & Physics
- Medical Sciences
- Neurology & Psychiatry
- Oncology & Cancer Science
- Pharmaceutical Sciences
