Comparison of the Effectiveness of Body-Weight Supported Treadmill Therapy on the Reduction of Asymmetry between Patients after Hip and Knee Arthroplasty
Miloslav KubÃÄek and Tomáš Brožek
1.Military Z???b?????tiŽn Center, Slapy nad Vltavou, Czech Republic 2.Department of Psychology, Charles University, Slapy nad Vltavou, Czech Republic
Published Date: 2023-11-20DOI10.36648/2574-285x.8.3.38
Miloslav Kubíček1and Tomáš Brožek2*
1Military Rehabilitation Center, Slapy nad Vltavou, Czech Republic
2Department of Psychology, Charles University, Slapy nad Vltavou, Czech Republic
- *Corresponding Author:
- Tomáš Brožek
Department of Psychology,
Charles University, Slapy nad Vltavou,
Czech Republic,
E-mail: tomasbrozek@centrum.cz
Received date: October 19, 2023, Manuscript No. IPIMP-23-18022; Editor assigned date: October 23, 2023, PreQC No. IPIMP-23-18002 (PQ); Reviewed date: November 06, 2023, QC No. IPIMP-23-18002; Revised date: November 13, 2023, Manuscript No. IPIMP-23-18002 (R); Published date: November 20, 2023, DOI: 10.36648/2574-285x.8.3.38
Citation: Kubíček M, Brožek T (2023) Comparison of the Effectiveness of Body-Weight Supported Treadmill Therapy on the Reduction of Asymmetry between Patients after Hip and Knee Arthroplasty. J Med Phys Appl Sci Vol.8 No.3:38.
Abstract
Background: Pain and weakness of the operated limb accompanying the patient during the first weeks of recovery leads to the emergence of significant gait asymmetry. Gait retraining protocol should be carefully designed so that asymmetric pathological gait is eliminated already in the early rehabilitation phase in order to prevent loss of bone mineral density in the under loaded limb, development of low back pain, osteoarthritis, or other musculoskeletal conditions.
Methods: A total of 40 patients recovering from total hip arthroplasty and 37 patients after total knee arthroplasty underwent a treatment program of five sessions combining body-weight supported treadmill exercise and conventional physiotherapy. The primary aim was to evaluate progress in the reduction of between-limb asymmetry of monitored gait parameters. The secondary aim was to compare the progress between patients recovering after hip and knee surgery.
Results: Patients after total hip arthroplasty experienced significant asymmetry reduction by 66%, 40%, 47%, 61%, 64% and 55% while patients after total knee arthroplasty experienced improvement by 50%, 20%, 35%, 63%, 58% and 50% in terms of stance time, step length, step time, swing time, swing/stance time ratio and weight bearing proportion, respectively. Mutual between-group comparison did not reveal a statistically significant difference between the results of patients after hip and knee surgery.
Conclusion: A statistically significant reduction in gait asymmetry in arthroplasty patients achieved during only 5 BWSTT sessions represents promise in postoperative rehabilitation from the point of view of effective gait restoration exercise and manually undemanding gait training physiotherapy.
Keywords
Antigravity treadmill; R-Force; Total knee replacement; Total hip replacement; Gait asymmetry; Postsurgery rehabilitation; Gait restoration
Introduction
One of the most common orthopedic surgeries worldwide is total joint replacement surgery, professionally known as arthroplasty, often caused by the most prevalent musculoskeletal condition called osteoarthritis [1]. In the USA alone, over a million Total Hip Arthroplasties (THA) and Total Knee Arthroplasties (TKA) are performed annually [2]. Primary replacement surgery in the knee area significantly predominates (54.5%) over primary replacement surgery in the hip area (38.6%) and female patients (58.5%) are affected more than men (38.6%) [3]. Given that the average age of THA and TKA patients is 66.1 and 67 years, respectively and more than 50% of patients are obese, with the growing trend of aging and increasing obesity of the population, it can be assumed that the number of arthroplasties will continue to grow [3,4]. The growing number of total joint replacement surgeries leads to an increase in costs associated with patient care, but also to a greater burden on physiotherapists providing post-operative rehabilitation [5]. The recovery of strength and function to normal levels is rare in TKA patients, but with appropriate postoperative rehabilitation care, it is possible to prevent patients from developing serious impairments and limitations and thus enable them to return to daily activities. Insufficient or inappropriate rehabilitation can cause serious limitations in functional performance, even years after the surgery [6].
Pain and weakness of the operated limb accompanying the patient during the first weeks of recovery leads to the emergence of significant gait asymmetry [4,7]. In the long term, as a result of insufficient or inappropriate rehabilitation, uneven load distribution may escalate in the necessity of joint replacement on the contralateral limb as a result of loss of bone mineral density in the underloaded limb, development of low back pain, osteoarthritis, or other conditions [8]. Gait retraining protocol should be carefully designed so that asymmetric pathological gait is eliminated already in the early rehabilitation phase and thus the risk of mechanical compensations, preservation of pain, disruption of proprioception and limitation of range of motion is minimized [8,9]. The inclusion of walking in the rehabilitation routine immediately after surgery is often limited by the increased risk of re-injury as a result of the operated limb overloading. In order to prevent this, modern technologies are currently being used, which allow the patient's weight to be completely or partially unloaded during walking exercises. This approach enables physicians to design a gait retraining protocol in such a way that the load on the lower limbs is gradually increased. Gait retraining therapies, during which body-weight support is provided to the patient, are collectively called Body-Weight Supported Treadmill Therapy (BWSTT) or antigravity treadmill therapy. The BWSTT principle results in the benefit of reducing the risk of re-injury and therefore the possibility of starting the gait retraining protocol earlier than with standard overground walking. Body-weight support also reduces the patient's urge to compensate to avoid pain within the operated segment and therefore the emergence of gait deviation demonstrated by walking asymmetry. It can be assumed that a gait retraining protocol consisting of BWSTT sessions will lead to an early reduction of gait asymmetry parameters and thus enable patients to practice walking with equal loading of both extremities.
The existing clinical evidence covers the positive effect of BWSTT on gait recovery in neurological patients and patients recovering from various conditions of the locomotors system [10,11]. Patients recovering after stroke, or spinal cord injury, as well as those affected by Parkinson's disease and cerebral palsy experienced a significant improvement in gait restoration during the BWSTT treatment program [12-20]. The positive effect on gait rehabilitation was also experimentally demonstrated in patients recovering from total knee and hip arthroplasty, anterior cruciate ligament reconstruction and lower limb fracture [21-23]. Despite this extensive evidence, the benefit from the point of view of between-limb asymmetry has not yet been fully proven, especially in patients recovering from injuries and surgeries of the musculoskeletal system. The only research to date is a pilot study investigating the effect of BWSTT on patients recovering from total joint arthroplasty. The authors of this study follow-up with the present trial aiming to verify the positive effect on a larger sample of patients and, above all, to compare in detail the reduction of gait asymmetry between THA and TKA patients [24].
Material and Methods
The research was conducted at two rehabilitation centers, at the Military Rehabilitation Center in slapy and the Rehabilitation Center in Jánské LáznÄ?, Czech Republic, between March and July 2023.
The sample size was estimated from a pilot study evaluating the reduction of asymmetry in patients after arthroplasty based on the values of the step time symmetry index [24]. To detect a significant (p<0.05) difference between data collected during the first and the last treatment session with 80% power, at least 33 patients are required.
The study followed the 1975 Declaration of Helsinki Ethical Guidelines adopted by the General Assembly of the World Medical Association (1997-2000) and by the Convention on Human Rights and Biomedicine of the Council of Europe (1997) [25].
Adult patients hospitalized in one of the participating clinics recovering from total hip or knee arthroplasty who were willing to participate were assigned to the research program. Pregnant and uncooperative patients were excluded from the study, as were patients with any of the contraindicated conditions-severe cardiovascular disease, bronchial asthma, angina pectoris, disc herniation, epilepsy, or any conditions with increased abdominal pressure.
Individual gait cycle parameters including stance time, step length, step time, swing time and weight bearing proportion were recorded using pressure sensors (H8C load cell) integrated directly into the walking path of the treadmill during each exercise session. The data was automatically stored in the device and after the completion of the whole treatment program; it was exported and assigned to respective patients by an independent research team.
The treatment program included five 20-minute BWSTT sessions followed by conventional physiotherapy scheduled every two to three days. An antigravity treadmill (BTL Industries Ltd.) was used, which allows changing the patient's load in the range of 0%-100%, changing the inclination in the range of 0%-15% and changing the speed setting -8 km/h to 25 km/h. The parameters are adapted to the patient's physical abilities at the beginning of each session and are expected to increase leading to progress during the course of treatment. The principle of BWSTT is based on positive pressure created inside an inflatable bag sealed around the lower half of the patient's body and surrounding the walking track of the treadmill. The patient is wearing special shorts that can be zipped into an inflatable bag. After a tight connection is ensured, the bag is inflated and the device is calibrated to the patient's weight. An exercise session can then be initiated.
For the purpose of evaluating the gait asymmetry reduction, the Symmetry Index (SI) indicator was calculated from the values measured during the first and last treatment and from the calculated swing/stance time ratio, using the following formula [26]:

Where P represents the respective gait parameter.
While an SI value of zero indicates the full symmetry of a given parameter, a value greater than 100 predicts total asymmetry. A negative value indicates that keep Paffected and Punaffected in subscript as shown above, because of this, the absolute values were used rather than the SI itself [27].
All data processing and analysis were performed in a customwritten script (MatLab R2010b, Mathworks, Inc., Narick, MA, USA). Before the statistical evaluation itself, the data were subjected to the normality test using the Shapiro-Wilk test and since the normal distribution was rejected, non-parametric tests were used for the purposes of further processing. The statistical significance of the changes achieved during the treatment course was evaluated using the Wilcoxon sign rank test, and a mutual comparison of the THA and TKA groups was performed using the Mann-Whitney test. A level of p<0.05 was considered statistically significant. Measured and calculated values are, due to the negative result of the normality test, presented as median (interquartile range).
Results
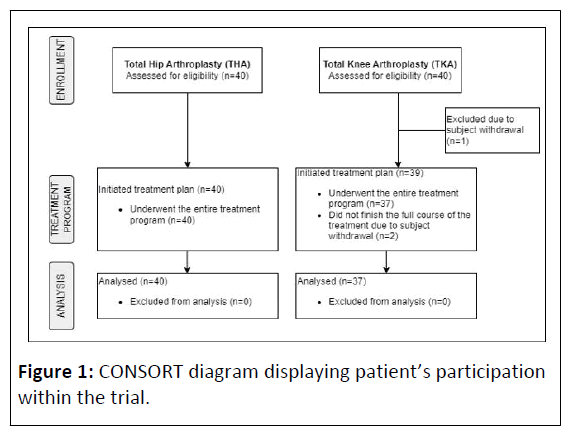
Of the originally assigned 80 patients (40 THA, 40 TKA), 3 patients were unable to complete the entire treatment program (Figure 1). The withdrawal occurred as a result of the patient's decision not to participate in the study any further. Neither these patients nor any others showed any adverse events during the entire research program. The exercise was generally well tolerated.
While the average treadmill speed setting was 1.8 ± 0.5 km/h during the first session, the last therapy was performed with an average speed setting of 2.4 ± 0.7 km/h across all patients. Weight unloading settings changed from 60% ± 20% to 50% ± 19% within the first and last therapy, respectively. Inclination was not changed and remained at 0% for all participants during the entire treatment program. Of the total number of 77 patients who completed the entire study course, the majority were women, and in the same proportion also patients after arthroplasty performed on the right leg. Detailed patient demographics are shown in Table 1.
| THA | TKA | Total | |
|---|---|---|---|
| Total number | 40 | 37 | 77 |
| Gender, male/ female | 19/21 | 17/20 | 36/41 |
| Age, mean (SD) | 65 (11) | 67 (11) | 66 (11) |
| Affected limb, right/ left | 21/19 | 20/17 | 41/36 |
Table 1: Patients’ demographics.
Stance time
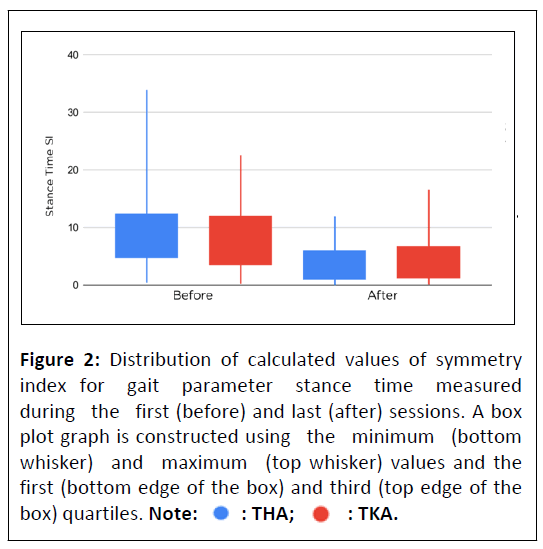
Between the first and last session, a decrease in stance time was measured in both TKA and THA patients (Table 2). A significant difference between the stance time of the affected and unaffected limb was demonstrated during the first and last session. Both groups experienced a statistically significant decrease from the point of view of the symmetry index, namely 66% and 50% for THA and TKA, respectively (Table 3). This asymmetry reduction is graphically shown in Figure 2.
| Knee | Hip | Wilcoxon (P=0.05) | ||||||
|---|---|---|---|---|---|---|---|---|
| Affected | Unaffected | Affected | Unaffected | Knee | Hip | |||
| Stance time (ms) | Before | Median | 1,140.00 | 1,220.00 | 1,154.50 | 1,296.00 | <0.001 | <0.001 |
| IQR | 202 | 257 | 248.75 | 215.25 | ||||
| After | Median | 1,141.00 | 1,162.00 | 1,073.00 | 1,112.00 | <0.001 | <0.001 | |
| IQR | 198 | 235 | 220 | 264.5 | ||||
| Step length (cm) | Before | Median | 41 | 42 | 41.5 | 44.5 | 0.021 | <0.001 |
| IQR | 14 | 14 | 16.5 | 16.5 | ||||
| After | Median | 41 | 44 | 45 | 45.5 | 0.017 | 0.492 | |
| IQR | 12 | 16 | 13 | 11.75 | ||||
| Step time (ms) | Before | Median | 728 | 667 | 783 | 724 | <0.001 | <0.001 |
| IQR | 182 | 158 | 168.25 | 169 | ||||
| After | Median | 724 | 688 | 658.5 | 657.5 | 0.014 | 0.013 | |
| IQR | 182 | 199 | 165.5 | 174.5 | ||||
| Swing time (ms) | Before | Median | 563 | 505 | 603.5 | 506.5 | 0.002 | <0.001 |
| IQR | 168 | 98 | 91 | 140 | ||||
| After | Median | 525 | 504 | 492.5 | 477 | 0.002 | 0.001 | |
| IQR | 154 | 159 | 92.75 | 134.75 | ||||
| Swing/Stance time (-) | Before | Median | 0.51 | 0.41 | 0.49 | 0.41 | <0.001 | <0.001 |
| IQR | 0.09 | 0.07 | 0.08 | 0.12 | ||||
| After | Median | 0.46 | 0.43 | 0.48 | 0.44 | <0.001 | <0.001 | |
| IQR | 0.06 | 0.06 | 0.07 | 0.08 | ||||
| Weight load (%) | Before | Median | 48 | 52 | 48 | 52.5 | <0.001 | <0.001 |
| IQR | 2 | 2 | 2.25 | 2.25 | ||||
| After | Median | 49 | 51 | 49 | 51 | <0.001 | <0.001 | |
| IQR | 2 | 2 | 1.25 | 1.25 | ||||
Table 2: Summary of collected data. Values are presented as median with Interquartile Range (IQR). P values determined by statistical analysis using Wilcoxon sign rank test evaluating between-limb difference meeting statistical significance (P<0.05) are highlighted in bold.
Figure 2: Distribution of calculated values of symmetry index for gait parameter stance time measured during the first (before) and last (after) sessions. A box plot graph is constructed using the minimum (bottom whisker) and maximum (top whisker) values and the first (bottom edge of the box) and third (top edge of the box) quartiles. 
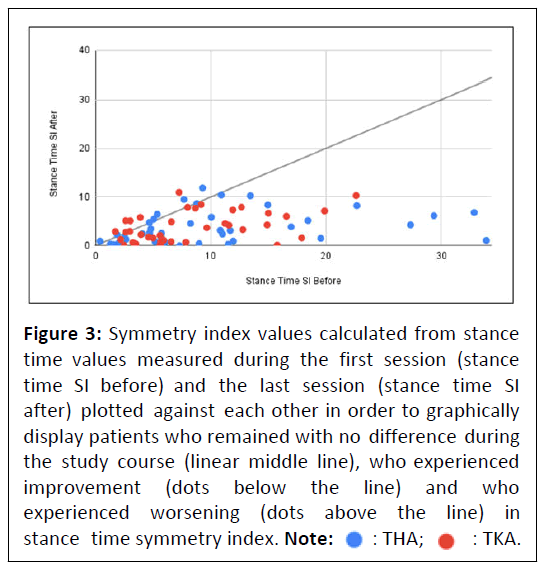
Out of the total number of patients, 82.5% of THA patients and 83.2% of TKA patients experienced an improvement in the stance time symmetry index. Figure 3 provides a graphic visualization. Although THA patients had a more pronounced decrease in stance time asymmetry, this difference compared to TKA patients did not reach statistical significance (Table 3).
Figure 3: Symmetry index values calculated from stance time values measured during the first session (stance time SI before) and the last session (stance time SI after) plotted against each other in order to graphically display patients who remained with no difference during the study course (linear middle line), who experienced improvement (dots below the line) and who experienced worsening (dots above the line) in stance time symmetry index.
| Knee | Hip | Mann-Whitney (P=0.05) | |||
|---|---|---|---|---|---|
| Stance time SI (-) | Before | Median | 6.599 | 8.521 | 0.491 |
| IQR | 8.027 | 7.548 | |||
| After | Median | 3.288 | 2.878 | 0.899 | |
| IQR | 4.789 | 4.89 | |||
| Wilcoxon (P=0.05) | <0.001 | <0.001 | - | ||
| Step length SI (-) | Before | Median | 5.825 | 5.142 | 0.874 |
| IQR | 4.494 | 7.616 | |||
| After | Median | 4.651 | 3.08 | 0.143 | |
| IQR | 4.544 | 4.027 | |||
| Wilcoxon (P=0.05) | 0.118 | 0.008 | - | ||
| Step time SI (-) | Before | Median | 8.451 | 6.415 | 0.748 |
| IQR | 11.861 | 11.865 | |||
| After | Median | 4.082 | 3.429 | 0.107 | |
| IQR | 4.509 | 5.899 | |||
| Wilcoxon (P=0.05) | <0.001 | <0.001 | - | ||
| Swing time SI (-) | Before | Median | 16.425 | 18.282 | 0.657 |
| IQR | 19.314 | 22.664 | |||
| After | Median | 6.093 | 7.092 | 0.508 | |
| IQR | 9.299 | 13.812 | |||
| Wilcoxon (P=0.05) | <0.001 | <0.001 | - | ||
| Swing/Stance time SI (-) | Before | Median | 19.802 | 23.98 | 0.592 |
| IQR | 28.046 | 29.428 | |||
| After | Median | 8.339 | 8.574 | 0.389 | |
| IQR | 11.822 | 12.201 | |||
| Wilcoxon (P=0.05) | <0.001 | <0.001 | - | ||
| Weight load SI (-) | Before | Median | 8 | 8.95 | 0.422 |
| IQR | 8 | 9 | |||
| After | Median | 4 | 4 | 0.872 | |
| IQR | 8 | 5 | |||
| Wilcoxon (P=0.05) | <0.001 | <0.001 | - | ||
Table 3: Summary of the basic characteristics of the calculated Symmetry Index (SI) values for individual gait parameters. The statistical significance of SI changes during the treatment course was determined using the Wilcoxon sign rank test. Mutual comparison of SI changes between patients recovering after Total Hip Arthroplasty (THA) and Total Knee Arthroplasty (TKA) was performed using the Mann-Whitney U test. P values meeting statistical significance (P<0.05) are highlighted in bold.
Step length
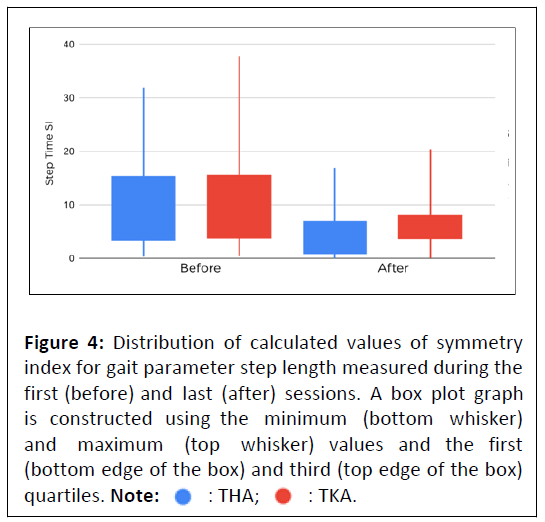
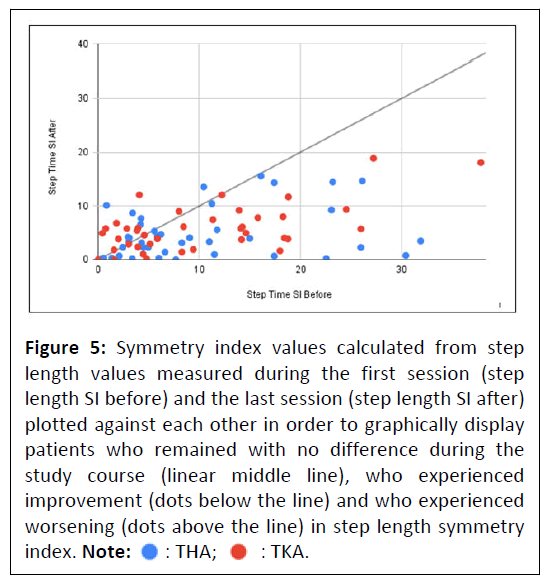
The step length increased during the study course, both in the affected and in the unaffected limb, in both knee and hip patients (Table 2). While in patients recovering after TKA a statistically significant difference between affected and unaffected limb remained, in THA patients the statistical significance of the between-limb difference disappeared during the treatment course. In terms of gait asymmetry, there was an improvement of 40% and 20% in THA and TKA patients, respectively (Table 3). The change in symmetry index reached statistical significance only in patients recovering after THA (Figure 4).
Figure 4: Distribution of calculated values of symmetry index for gait parameter step length measured during the first (before) and last (after) sessions. A box plot graph is constructed using the minimum (bottom whisker) and maximum (top whisker) values and the first (bottom edge of the box) and third (top edge of the box) quartiles. 
While 63% of THA patients experienced an improvement in terms of symmetry index and 10% remained with no change, in the case of TKA patients a decrease in asymmetry was recorded in 56% and 11% remained with no difference. Figure 5 provides a graphic visualization of the patient’s distribution according to the change in the symmetry index during the study course.
Figure 5: Symmetry index values calculated from step length values measured during the first session (step length SI before) and the last session (step length SI after) plotted against each other in order to graphically display patients who remained with no difference during the study course (linear middle line), who experienced improvement (dots below the line) and who experienced worsening (dots above the line) in step length symmetry index. 
The difference in asymmetry between patients recovering from THA and TKA did not reach statistical significance either for data obtained during the first or the last session (Table 3).
Step time
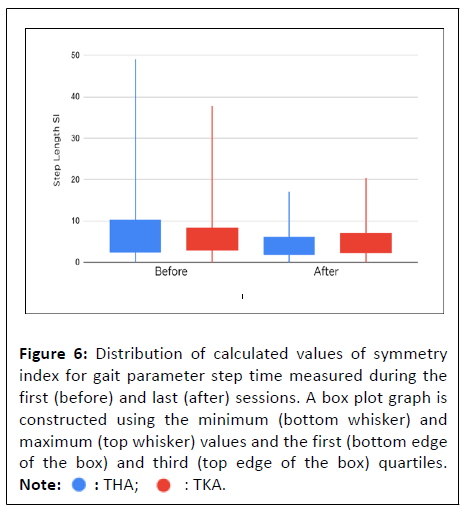
In the case of the step time parameter, there was a decrease in the value during the study course in both patients’ groups (Table 2). The opposite trend was only reported in TKA patients for the unaffected limb. Both groups experienced a statistically significant between-limb difference both during the first and last treatment session. There was a statistically significant asymmetry reduction in both groups between the first and last exercise session by 47% and 35% for the THA and TKA groups, respectively (Figure 6).
Figure 6: Distribution of calculated values of symmetry index for gait parameter step time measured during the first (before) and last (after) sessions. A box plot graph is constructed using the minimum (bottom whisker) and maximum (top whisker) values and the first (bottom edge of the box) and third (top edge of the box) quartiles.
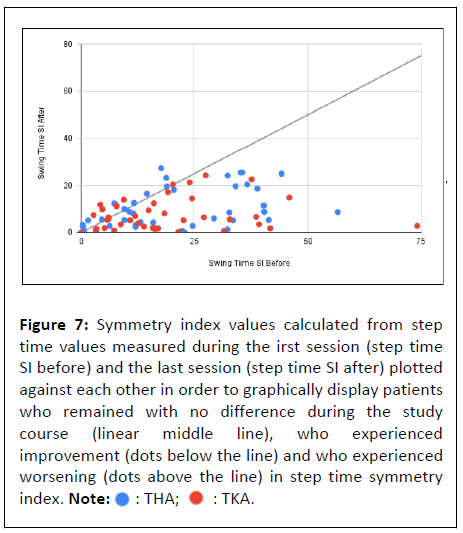
Of all patients who underwent the complete treatment program, 80% of THA and 75% of TKA patients experienced improvement in step time asymmetry. Their distribution is graphically shown in Figure 7. Despite relatively obvious changes in the achieved improvements in THA and TKA patients, mutual group comparison did not reveal statistically significant differences (Table 3).
Figure 7: Symmetry index values calculated from step time values measured during the irst session (step time SI before) and the last session (step time SI after) plotted against each other in order to graphically display patients who remained with no difference during the study course (linear middle line), who experienced improvement (dots below the line) and who experienced worsening (dots above the line) in step time symmetry index.
Swing time
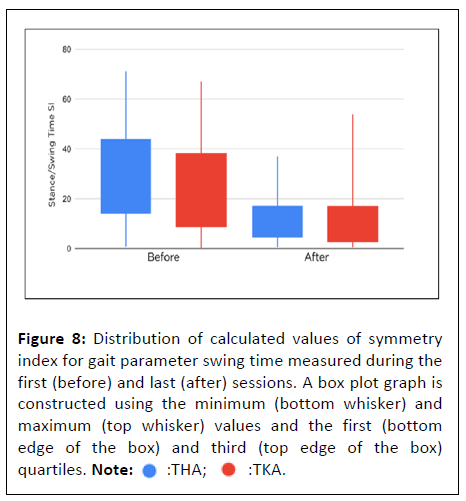
Both THA and TKA patients experienced a decrease in swing time for both affected and unaffected limbs during the study course (Table 2). Significant between-limb difference was found during the first and last treatment session. Both groups of patients also experienced a statistically significant improvement in swing time asymmetry by 61% and 63% in THA and TKA patients, respectively (Figure 8).
Figure 8: Distribution of calculated values of symmetry index for gait parameter swing time measured during the first (before) and last (after) sessions. A box plot graph is constructed using the minimum (bottom whisker) and maximum (top whisker) values and the first (bottom edge of the box) and third (top edge of the box) quartiles. 
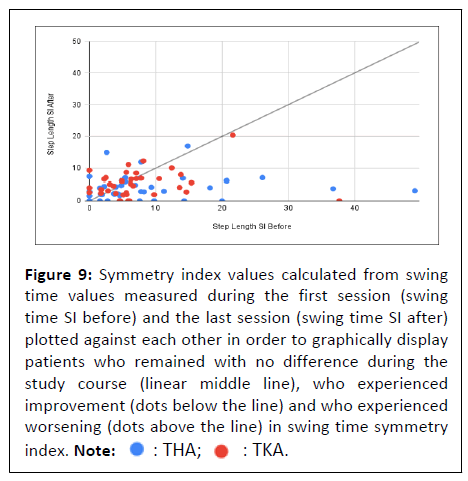
Of all patients, 70% of THA and 81% of TKA patients experienced an improvement in swing time asymmetry (Figure 9).
Figure 9: Symmetry index values calculated from swing time values measured during the first session (swing time SI before) and the last session (swing time SI after) plotted against each other in order to graphically display patients who remained with no difference during the study course (linear middle line), who experienced improvement (dots below the line) and who experienced worsening (dots above the line) in swing time symmetry index.
Although TKA patients experienced a more pronounced improvement in terms of symmetry index than THA patients, the statistical analysis did not evaluate this difference as statistically significant (Table 3).
Swing/Stance time
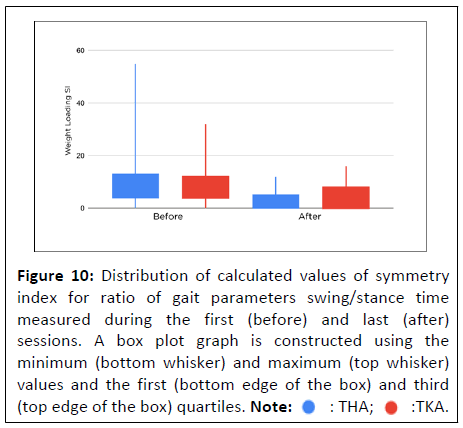
The swing/stance time ratio increased during the treatment program in the unaffected limb and decreased in the affected limb for both THA and TKA patients (Table 2). Although a statistically significant between-limb difference persisted throughout the study course, the symmetry index of swing/ stance time ratio recorded a statistically significant decrease of 64% and 58% in THA and TKA patients, respectively (Figure 10).
Figure 10: Distribution of calculated values of symmetry index for ratio of gait parameters swing/stance time measured during the first (before) and last (after) sessions. A box plot graph is constructed using the minimum (bottom whisker) and maximum (top whisker) values and the first (bottom edge of the box) and third (top edge of the box) quartiles. 
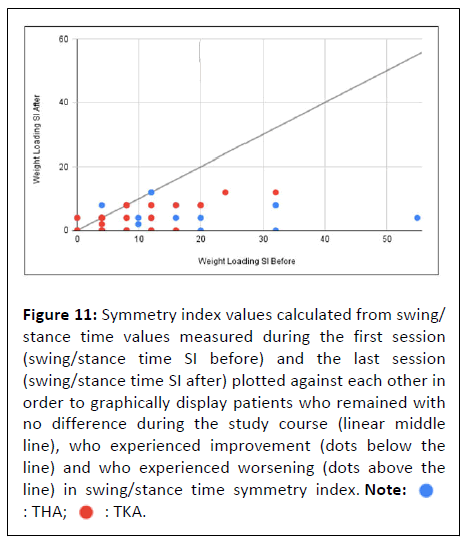
Of all patients who underwent the entire treatment program, both 78% THA and TKA patients achieved an improvement in the swing/stance time symmetry index (Figure 11). When comparing the results of asymmetry reduction in the group of THA and TKA patients, no statistically significant difference was found (Table 3).
Figure 11: Symmetry index values calculated from swing/ stance time values measured during the first session (swing/stance time SI before) and the last session (swing/stance time SI after) plotted against each other in order to graphically display patients who remained with no difference during the study course (linear middle line), who experienced improvement (dots below the line) and who experienced worsening (dots above the line) in swing/stance time symmetry index. 
Weight bearing proportion
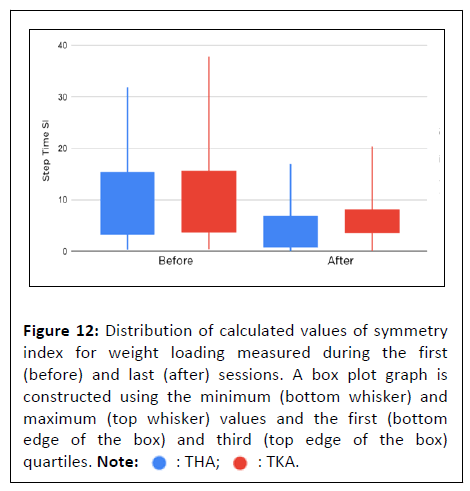
It has been shown that both patients recovering after THA and TKA tend to put more load on the unaffected limb than on the affected limb during the rehabilitation phase (Table 2). The difference between the loads on both lower limbs was reduced during the treatment course, which was also confirmed by a statistically significant reduction of the symmetry index by 55% in THA and 50% in TKA patients (Figure 12)
Figure 12: Distribution of calculated values of symmetry index for weight loading measured during the first (before) and last (after) sessions. A box plot graph is constructed using the minimum (bottom whisker) and maximum (top whisker) values and the first (bottom edge of the box) and third (top edge of the box) quartiles. 
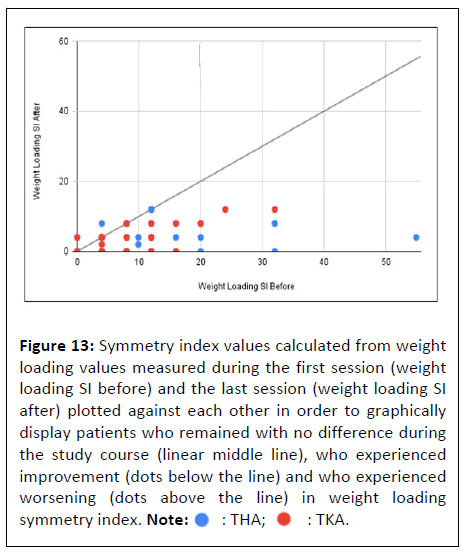
Out of a total of 77 patients, only 3 experienced worsening of weight loading asymmetry (Figure 13). On the contrary, 39% of patients experienced full symmetry recovery during the treatment program in terms of weight bearing proportion. Mutual between-group comparisons did not reveal statistically significant differences between THA and TKA patients (Table 3).
Figure 13: Symmetry index values calculated from weight loading values measured during the first session (weight loading SI before) and the last session (weight loading SI after) plotted against each other in order to graphically display patients who remained with no difference during the study course (linear middle line), who experienced improvement (dots below the line) and who experienced worsening (dots above the line) in weight loading symmetry index. 
Discussion
The focus and design of the present trial followed the previously published pilot study [24]. From the point of view of the trends of changes in individual gait parameters and their symmetry indexes, both studies are completely consistent. The present study achieved slightly better results in terms of asymmetry reduction of certain gait parameters.
This difference can be attributed to the greater prevalence of TKA patients compared to THA patients in the pilot study. A comparison of the results between the two groups of patients in the present trial reveals a difference, albeit statistically insignificant, in favor of THA patients. It can be assumed that the better response of THA patients is due to generally faster healing of the hip compared to the knee joint.
The hip joint is essentially simpler, the operation is shorter and less complicated. In contrast, the knee joint is significantly more complex and its replacement is more demanding. The surgeon must carefully adjust the joint to guarantee the ability to rotate, lex, move and absorb loads and to ensure full stability and balance. For these reasons, the recovery time after total knee replacement surgery is longer compared to total hip replacement.
In general, the complete recovery time for TKA patients varies between 3-12 months, while for THA patients it is between 2-6 months. Therefore, it can be assumed that TKA patients would achieve similar results to THA patients, but in several more sessions.
A reduction in gait asymmetry is completely expected during the gait retraining program, but a significant improvement after only 5 BWSTT sessions brings promise in post-operative rehabilitation. The BWSTT principle allows patients to incorporate gait retraining already in the early rehabilitation phase without the risk of overloading and re-injury of the operated segment.
The patient does not require unilateral support in the form of crutches or a cane, which reduces the risk of developing a gait deviation leading to further asymmetry. The gradual increase in weight load during the treatment program allows the patient to adapt with postural control and promoted coordination of the lower limbs. This eliminates the necessity of the patient for conscious or unconscious compensation for pain within the impaired limb, which enables faster restoration of walking symmetry.
In addition, during therapy, the patient can fully concentrate on walking without fear of falling or overloading the limb. The physiotherapist has full control over the therapy and instead of physically demanding exercise or manual support of the patient during overground walking; he can fully concentrate on the ongoing activity in terms of walking cycle and gait asymmetry.
In addition to the bene its of the study, it is also necessary to mention its limitations. The main shortcoming can be considered the absence of a control group with a comparable number of THA and TKA patients, in which the natural development of asymmetry without the use of BWSTT would be observed.
Comparing the results would give us a more accurate idea of the BWSTT bene it. It would also help to expand the study by measuring walking parameters and their asymmetry before the arthroplasty itself. This would provide a better idea of the change in asymmetry as a result of surgery and the progress of subsequent walking recovery as part of postoperative care.
Despite the research limitations mentioned above, it must be emphasized that this is the very first study comparing the effect of BWSTT therapy in patients recovering after total hip and knee arthroplasty. Further research could focus on expanding the comparison with other musculoskeletal conditions of the lower limbs, such as fractures, arthrosis, osteoporosis and others.
Conclusion
A treatment program consisting of only 5 BWSTT sessions led to a statistically significant reduction in gait asymmetry in patients recovering after total hip and knee arthroplasty. The mutual between-group comparison was in favor of patients after hip replacement surgery but as it did not reach statistical significance it can be concluded that the BWSTT therapy achieves the same effectiveness in both groups. These findings and the BWSTT principle represent promise in postoperative rehabilitation from the point of view of effective impact on gait restoration and manually undemanding gait training physiotherapy.
References
- Blom AW, Donovan RL, Beswick AD, Whitehouse MR, Kunutsor SK (2021) Common elective orthopaedic procedures and their clinical effectiveness: Umbrella review of level 1 evidence. BMJ 374: 1511.
[Crossref], [Google Scholar], [Indexed]
- Kremers HM, Larson DR, Crowson CS, Kremers WK, Washington RE, et al. (2015) Prevalence of total hip and knee replacement in the united states. J Bone Joint Surg Am 97: 1386-1397.
[Crossref], [Google Scholar], [Indexed]
- Siddiqi A, Levine BR, Springer BD (2022) Highlights of the 2021 American joint replacement registry annual report. Arthroplasty Today 13: 205-207.
[Crossref], [Google Scholar], [Indexed]
- Lugade V, Wu A, Jewett B, Collis D, Chou LS (2010) Gait asymmetry following an anterior and anterolateral approach to total hip arthroplasty. Clin Biomech 25: 675–680.
[Crossref], [Google Scholar], [Indexed]
- Gardezi M, Ottesen TD, Tyagi V, Sherman JJZ, Grauer JN (2021) Arthroplasty implants and materials: Cost awareness and value perception. PloS One 16: 0255061.
[Crossref], [Google Scholar], [Indexed]
- Bade MJ, Stevens-Lapsley JE (2011) Early high-intensity rehabilitation following total knee arthroplasty improves outcomes. J Orthop Sports Phys Ther 41: 932-941.
[Crossref], [Google Scholar], [Indexed]
- Christiansen CL, Bade MJ, Weitzenkamp DA, Stevens-Lapsley JE (2013) Factors predicting weight-bearing asymmetry 1month after unilateral total knee arthroplasty: Across-sectional study. Gait Posture 37: 363–367.
[Crossref], [Google Scholar], [Indexed]
- Cabral S (2018) Gait symmetry measures and their relevance to gait retraining. Handbook of Human Motion 429-447.
- Vazquez-Galliano J, Kimawi I, Chang L (2014) Biomechanics of gait and treatment of abnormal gait patterns. Physical Medicine and Rehabilitation.
- Prunerová A, Vinarov E (2023) Increase in metabolic rate and related parameters during an antigravity treadmill exercise program in neurological patients. J Neurodegenero Dis Disord 6: 4.
- Savarino D, Prunerova A (2023) Comparison of therapeutic progression using anti-gravity treadmill for different postoperative and post injury conditions. J Clin Exp Orthopr 9: 401.
- Atan T, Taskiran OO, Tokcaer AB, Karatas GK, Caliskan AK, et al. (2019) Effects of different percentages of body weight supported treadmill training in Parkinson‘s disease: A double-blind randomized controlled trial. Turk J Med Sci 49: 999-1007.
[Crossref], [Google Scholar], [Indexed]
- Covarrubias-Escudero F, Rivera-Lillo G, Torres-Castro R, Varas-Díaz G (2019) Effects of body weight-support treadmill training on postural sway and gait independence in patients with chronic spinal cord injury. J Spinal Cord Med 42: 57-64.
[Crossref], [Google Scholar], [Indexed]
- Plummer P, Behrman AL, Duncan PW, Spigel P, Saracino D, et al. (2007) Effects of stroke severity and training duration on locomotor recovery after stroke: A pilot study. Neurorehabil Neural Repair 21: 137-151.
[Crossref], [Google Scholar], [Indexed]
- Duncan PW, Sullivan KJ, Behrman AL, Azen SP, Nadeau SE, et al. (2011) Body-weight–supported treadmill rehabilitation after stroke. N Engl J Med 364: 2026-2036.
[Crossref], [Google Scholar], [Indexed]
- Combs SA, Dugan EL, Ozimek EN, Curtis AB (2013) Bilateral coordination and gait symmetry after body-weight supported treadmill training for persons with chronic stroke. Clin Biomech 28: 448-453.
[Crossref], [Google Scholar], [Indexed]
- McCain KJ, Pollo FE, Baum BS, Coleman SC, Baker S, et al. (2008) Locomotor treadmill training with partial body-weight support before overground gait in adults with acute stroke: A pilot study. Arch Phys Med Rehabil 89: 684-691.
[Crossref], [Google Scholar], [Indexed]
- Lura DJ, Venglar MC, Van Duijn AJ, Csavina KR (2019) Body weight supported treadmill vs. overground gait training for acute stroke gait rehabilitation. Int J Rehabil Res 42: 270-274.
[Crossref], [Google Scholar], [Indexed]
- Miller EW, Quinn ME, Seddon PG (2002) Body weight support treadmill and overground ambulation training for two patients with chronic disability secondary to stroke. Phys Ther 82: 53-61.
[Crossref], [Google Scholar], [Indexed]
- Lotfian M, Dadashi F, Rafieenazari Z, Shahroki A, Rasteh M, et al. (2019) The effects of anti-gravity treadmill training on gait characteristics in children with cerebral palsy. Annu Int Conf IEEE Eng Med Biol Soc 2019: 5256-5259.
[Crossref], [Google Scholar], [Indexed]
- Hesse S, Werner C, Seibel H, Frankenberg SV, Kappel EM, et al. (2003) Treadmill training with partial body-weight support after total hip arthroplasty: A randomized controlled trial. Arch Phys Med Rehabil 84: 1767-1773.
[Crossref], [Google Scholar], [Indexed]
- Palke L, Schneider S, Karich B, Mende M, Josten C, et al. (2022) Anti-gravity treadmill rehabilitation improves gait and muscle atrophy in patients with surgically treated ankle and tibial plateau fractures after one year: A randomised clinical trial. Clin Rehabil 36: 87-98.
[Crossref], [Google Scholar], [Indexed]
- Webber SC, Horvey KJ, Pikaluk YMT, Butcher SJ (2014) Cardiovascular responses in older adults with total knee arthroplasty at rest and with exercise on a positive pressure treadmill. Eur J Appl Physiol 114: 653-662.
[Crossref], [Google Scholar], [Indexed]
- Kubícek M, Brozek T (2023) The effect of body-weight supported treadmill therapy program on the gait asymmetry in patients after lower limb arthroplasty. Adv Tech Biol Med 11: 415.
- Council of Europe (1997) Convention for protection of human rights and dignity of the human being with regard to the application of biology and biomedicine: Convention on human rights and biomedicine. Kennedy Inst Ethics J 7: 277-290.
[Crossref], [Google Scholar], [Indexed]
- Ali H (2022) How long does it take to recover from joint replacement? Golden State Orthopedics & Spine.
- Miller EW, Quinn ME, Seddon PG (2002) Body weight support treadmill and overground ambulation training for two patients with chronic disability secondary to stroke. Phys Ther 82: 53–61.
[Crossref], [Google Scholar], [Indexed]
Open Access Journals
- Aquaculture & Veterinary Science
- Chemistry & Chemical Sciences
- Clinical Sciences
- Engineering
- General Science
- Genetics & Molecular Biology
- Health Care & Nursing
- Immunology & Microbiology
- Materials Science
- Mathematics & Physics
- Medical Sciences
- Neurology & Psychiatry
- Oncology & Cancer Science
- Pharmaceutical Sciences
