Feasibility of a Novel Gamma Radiography Mammo System
Eslam M. Taha, Abdalmajeid M. Alyassin
Abstract
This research aims to study gamma radiography feasibility in mammography through simulation. GATE simulation package was used to define the feasibility limits and to test several parameters including energy range, activity, source size and dose. An ACR-like mammography phantom was generated in simulation and the produced images were used for visual and analytical assessments. Some images were processed and enhanced by an application developed using the Visualization Toolkit. A special technique was developed to correct the gamma radiation field inhomogeneity and a morphological operator based technique was used to automatically extract regions of interest from the simulated images to estimate the contrast and signal-to-noise ratio. The results of the analytical and visual assessments demonstrated that gamma radiation of 35 keV energy or less produces acceptable mammography images. Higher energy photons produced mammography images but did not pass the rigorous clinical acceptable tests. The maximum feasible cylindrical source size was found to be 4 mm in diameter and 5 mm in thickness. An Am-241 source showed to produce acceptable mammography images in simulation using energy sensitive detectors with an average glandular dose of 1.2 mGy.
Keywords
Gamma-ray radiography, Am-241, Medical imaging, Mammography
Introduction
Each Medical Imaging system has features that are more suitable to be used in certain medical situations than other systems. This motivates the continuous development of imaging systems with better features and fewer drawbacks. Some of the drawbacks are related to the radiation energy. For instance, X-ray is widely used in many imaging modalities such as CT, fluoroscopy and mammography. The ability to control the beam energy is a process shared among all X-ray modalities, because X-ray is produced as a spectrum that includes undesired low and high energy photons. The low energy photons produced will not give useful diagnostic information and will contribute in unnecessary radiation dose to the patient. The high energy photons will contribute to the decrease in image contrast [1]. This shortcoming is minimized by using certain types of filters [2] In addition; X-Ray imaging systems are electronically complicated and require a high voltage generator to produce the beam as well as continuous maintenance. These drawbacks may be overcome by the use of gamma radiation instead of X-ray. Unlike X-ray, gamma radiation doesn’t require a generator or an electronically complicated system to produce the mono-energetic beam. These features of gamma radiation are advantageous in certain rough environments [3] recently; gamma was used in several studies to produce clinically acceptable radiographic medical images. These studies suggested that better quality images could be obtained with the use of proper activity, an image enhancement system, and the use of a scattering removal technique [4,5]. The main difference between mammography and conventional radiology is the useful energy range. Breast contains several soft tissues that have very similar attenuation properties. The attenuation difference between these soft tissues is higher at lower energies (10-15 keV) and becomes lower at higher energies (>35 keV) [2]. This means that the main challenges to utilizing gamma in mammography lies in finding a source that produced energy within or close enough to the mammography range. In this paper, gamma feasibility in mammography will be studied through simulation. Simulation will help determine under what conditions gamma radiation should be considered feasible in mammography. The determination of these conditions will enable finding proper radioactive sources to be used in gamma mammography. The simulation will be carried out using GATE package. GATE is a GEANT4 application for tomographic emission. Nevertheless, several studies showed it is also applicable in low energy studies such as mammography [6-8]. Additionally, an open source visualization package, The Visualization Toolkit “VTK”, will be used to create an application to process and enhance images. The developed application will assist in providing more accurate analytical assessment and will enhance the produced images for visual assessment [9].
Materials
GATE
GATE is a simulation package dedicated for tomographic emission with a wide range of applications in different radiation physics fields [10]. In GATE, volumes with different shapes may be created and assigned a material type. Radioactive sources can be generated through defining several parameters such as particle type, energy type, activity, half-life, beam distribution and source shape. Additionally, actors may be attached to a volume to record useful information such as dose distribution, number of interactions, and energy spectrum and many others.
ACR mammography like phantom
In simulation, an ACR Mammography like phantom was created [11]. The phantom consists of a 4.4 cm acrylic phantom. It contains a 7 mm wax insert that has 16 test objects, including 6 nylon fibers, 5 micro-calcifications groups and 5 masses. Two models were developed of the phantom. The first is a minimized version of the phantom with dimensions of 3.3 by 4.4 cm. This was created to speed up the simulation processes. The second is more similar in size to the ACR phantom with dimensions of 11. 11 by 4.4 cm. Objects surface area were shrunk in the minified version so objects would fit in the wax insert. Thickness of the objects in both phantoms was the same as in the ACR phantom [12,13].
Ideal detectors
All simulation experiments were conducted using a 100% efficient “Ideal Detector” to reduce the simulation time. All detectors have a pixel size of 0.05 mm, which produce satisfactory samples to see the smallest object within the phantom according to the Nyquist criteria [14].
Radioactive dources
Three types of sources were used. A point source, cylindrical source and plane source. Each source type was generated to fulfill a certain objective which will be discussed later. The energies of the sources were set to 26, 30, 35, 40, 50 or 60 keV depending on the experiment.
The visualization toolkit
VTK is an open source package that was used to create scientific data visualization applications [9]. It was used here to create an application intended to process the produced images from Gate simulation. The application was developed with various tools to process and enhance images such as reading, scaling, resizing, contrast adjustment, and applying various filters [15].
Methods
Analytical data estimation using the region of interest tool
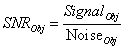
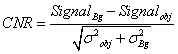
The region of interest tool “ROI” was used to obtain the analytical data. The ROI tool has the ability to use several builtin ROIs to automatically estimate contrast signal, and noise for all test objects in the simulated images. The process starts with combining the simulated images with a mask containing several ROIs to estimate the object and the background values. The ROIs were first generated by assuming that all the inserts in the ACR-like phantom were made of lead. The output image clearly showed all the inserts in the ACR phantom. A binary mask was then generated from all the inserts in the phantom. Next each ROI was modified by applying an erosion based technique to the mask in order to exclude the boundary of the objects and to retain the rest to define the regions of interests. For each ROI, the mean and the standard deviation were obtained and stored. Using the same ROI, this process is repeated for the next image until all images of the same ROI are processed. Then the ROI is changed for the next object and the process is repeated. The stored values are later used to calculate signal-to-noise (SNR) ratio and contrast-to-noise ratio (CNR) as shown in Equations 1, 2.
 (1)
(1)
 (2)
(2)
Where  and
and  are the standard deviation of the objects and
background respectively.
are the standard deviation of the objects and
background respectively.
The ROI tool includes also an option to correct for the field inhomogeneity before calculating the mean and standard deviation values. The field correction method is based on obtaining an image of a flood phantom Figure 1. The image is heavily smoothed with a Gaussian filter. The smoothed image is subtracted from its maximum value and then the absolute value is taken for the image which results in an inverted field image Figure 2. The values of the inverted field are then linearly rescaled from 1 to the maximum to minimum ratio, resulting in the field correction image seen in Figure 2. Multiplying this image by the masked image results in a field inhomogeneity corrected image.

Figure 1: Image of the field before correction. (a) shows a profile taken from one corner to its opposite corner (b) shows the flood field image.

Figure 2: The field corrected image. (a) shows a profile taken from one corner to its opposite corner (b) shows the corrected field image.
Feasibility study under ideal conditions
A point source was placed at a source to image distance (SID) of 9.4 cm and a source to object distance (SOD) of 5 cm from the mini phantom. The photoelectric interaction was the only allowed interaction in the simulation. The purpose of this experiment was to determine the energy range of gamma feasibility. Using the small phantom and a short SID helps to deliver high exposure to the detector in a short time. It’s suggested in the literature that delivering around 500 μR to the detector would be enough to produce an acceptable image [14]. The required activity to deliver such exposure at an SID of 9.4 cm for a gamma source emitting 100% 26 keV photons was calculated to be 1.2 Ci using Equation 3.
 (3)
(3)
Where A is the activity, d is the distance, and  is gamma specific
factor. The 26 KeV was selected because Am-241 emits this
monoenergteic energy [15].
is gamma specific
factor. The 26 KeV was selected because Am-241 emits this
monoenergteic energy [15].
Source size
Source size is one of the factors that affect image quality. As the size increases the image becomes more blurry and the spatial resolution is degraded. In this experiment, a source emitting a 26 keV is placed on the top of the chest wall with an SID of 25 cm. Cylinder sources were used with a thickness of 5 mm and a variable diameter. Different diameters of 0.5, 1, 2, 4, 8, and 16 mm were tested. All photon interaction with matter was allowed in this experiment.
Activity and dose
A plane source that emits a parallel beam was used to determine the amount of activity needed to produce an acceptable image and determine the average glandular dose. The plane source was used to make the source closer without causing field inhomogeneity in the image. In addition to the ideal detector, a dose actor was attached to the phantom to estimate the dose entering and exiting the phantom. This consequently allowed for the average glandular dose estimation using equation 4:
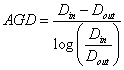 (4)
(4)
The exposure used was dependent on the automatic exposure settings. All experiments were terminated once the image receives a preset exposure. Previous experiments indicated that image quality doesn’t improve much beyond achieving a pixel mean value of about 2000; thus, all experiments were terminated once the value of 2000 (preset exposure) was achieved. Similarly, the larger phantom was used in this experiment with all physical photon interaction processes allowed in the simulation.
Visual assessment
Assessing the images visually helps understand the analytical results. All the simulated images were assessed using the ACR mammography phantom. According to the ACR mammography phantom user manual, a good imaging system should be able to see at least three speck groups, four fibers, and three masses [12].
Results and Discussion
The automatic region of interest tool of the analytical data was successful in eliminating the inter-user and the intra-user variability and in estimating accurately and precisely the SNR and CNR.
Feasibility Study under Ideal Conditions
Figures 3 and 4 show the degradation of image quality as the energy increases. Table 1 show the SNR and CNR values for the entire test objects within the phantom at different energies.

Figure 3: An image of the smaller phantom with 26 keV (left), 30 keV (middle), and 35 keV (right).

Figure 4: An image of the smaller phantom with 40 keV (left), 50 keV (middle), and 60 keV (right).
| Object | SNR | CNR | ||||||||||
|---|---|---|---|---|---|---|---|---|---|---|---|---|
| 26 KeV | 30 KeV | 35 KeV | 40 KeV | 50 KeV | 60 KeV | 26 KeV | 30 KeV | 35 KeV | 40 KeV | 50 KeV | 60 KeV | |
| Fiber1 | 52 | 57 | 62 | 64 | 66 | 67 | 0.74 | 0.67 | 0.63 | 0.56 | 0.53 | 0.51 |
| Fiber2 | 68 | 77 | 83 | 87 | 90 | 90 | 0.51 | 0.47 | 0.43 | 0.4 | 0.37 | 0.34 |
| Fiber3 | 68 | 78 | 84 | 88 | 91 | 92 | 0.43 | 0.4 | 0.37 | 0.35 | 0.33 | 0.3 |
| Fiber4 | 52 | 58 | 62 | 64 | 65 | 66 | 0.57 | 0.53 | 0.5 | 0.49 | 0.47 | 0.45 |
| Fiber5 | 60 | 66 | 70 | 73 | 76 | 78 | 0.33 | 0.31 | 0.29 | 0.28 | 0.26 | 0.25 |
| Fiber6 | 71 | 83 | 90 | 94 | 95 | 97 | 0.09 | 0.09 | 0.05 | 0.03 | 0 | -0.01 |
| MC1 | 27 | 40 | 55 | 69 | 84 | 91 | 3.34 | 2.96 | 2.35 | 1.81 | 1.02 | 0.63 |
| MC2 | 34 | 46 | 58 | 63 | 70 | 73 | 3.08 | 2.52 | 1.93 | 1.42 | 0.87 | 0.6 |
| MC3 | 40 | 48 | 62 | 69 | 74 | 73 | 2.84 | 2.18 | 1.64 | 1.26 | 0.76 | 0.52 |
| MC4 | 53 | 72 | 74 | 76 | 82 | 84 | 2.67 | 2.14 | 1.39 | 0.93 | 0.55 | 0.34 |
| MC5 | 73 | 86 | 96 | 97 | 97 | 90 | 2.03 | 1.52 | 1.1 | 0.78 | 0.56 | 0.29 |
| Mass1 | 65 | 75 | 83 | 87 | 90 | 92 | 0.88 | 0.71 | 0.56 | 0.47 | 0.36 | 0.33 |
| Mass2 | 70 | 79 | 83 | 89 | 90 | 94 | 0.7 | 0.66 | 0.59 | 0.55 | 0.5 | 0.48 |
| Mass3 | 95 | 103 | 125 | 138 | 152 | 185 | 0.51 | 0.42 | 0.4 | 0.37 | 0.31 | 0.31 |
| Mass4 | 72 | 76 | 83 | 84 | 104 | 101 | 0.37 | 0.35 | 0.33 | 0.27 | 0.25 | 0.23 |
| Mass5 | 80 | 75 | 86 | 100 | 94 | 104 | 0.59 | 0.53 | 0.53 | 0.51 | 0.48 | 0.51 |
Table 1: CNR and SNR values for test objects for various energies.
Generally, as the object thickness decreases more photons reach the detector resulting in a higher signal. In addition, the CNR decreases as energy increases because the difference in the attenuation between the objects and background acrylic decreases. The short SID and fibers cylindrical tilted shape causes their SNR and CNR to be highly affected by the inverse square law of the exposure. Masses are less affected due to their circular surface area which allows for better sampling. Microcalcifications are much less affected by field inhomogeneity; thus, their SNR and CNR values are dependent mainly on their thickness. Applying the field correction technique removes some of the field inhomogeneity as seen in Figure 5. CNR and SNR values for fibers and masses become less affected by field inhomogeneity as seen in Table 2.

Figure 5: Image from a 26 keV point source exposure before (left) and after (right) field correction.
| SNR | CNR | ||||
|---|---|---|---|---|---|
| Object | Before | After | Before | After | |
| Fiber1 | 52 | 69 | 0.74 | 0.38 | |
| Fiber2 | 68 | 70 | 0.51 | 0.31 | |
| Fiber3 | 68 | 70 | 0.43 | 0.21 | |
| Fiber4 | 52 | 69 | 0.57 | 0.25 | |
| Fiber5 | 60 | 70 | 0.33 | 0.25 | |
| Fiber6 | 71 | 71 | 0.09 | 0.06 | |
| Mean | 61.8 | 69.8 | 0.4 | 0.2 | |
| Stdev | 8.4 | 0.8 | 0.2 | 0.1 | |
| Mass1 | 27 | 67 | 3.34 | 0.78 | |
| Mass2 | 34 | 70 | 3.08 | 0.38 | |
| Mass3 | 40 | 72 | 2.84 | 0.36 | |
| Mass4 | 53 | 72 | 2.67 | 0.21 | |
| Mass5 | 73 | 79 | 2.03 | 0.36 | |
| Mean | 45.4 | 72 | 2.8 | 0.4 | |
| Stdev | 18.1 | 4.4 | 0.5 | 0.2 | |
Table 2: CNR and SNR values from a 26 keV point source before and after correcting the field inhomogeneity.
Source size
Increasing the source size increases the penumbra resulting in more blurry objects. Images in Figure 6 show that the objects become difficult to see with cylinder sources larger than 4 mm.

Figure 6: Images resulting from different source sizes (a) 0.5 mm, (b) 1 mm, (c) 2 mm, (d) 4 mm, (e) 8 mm, (f) 16 mm.
Activity and dose
Table 3 shows the amount of activity the phantom was exposed to in order to achieve an acceptable gray level value. Also Table 3 shows the estimated average glandular dose estimated using Equation 4. For a cylinder source with 5 mm thickness and 4 mm in diameter at an SID of 30 cm, the required activity to achieve an acceptable image in 1 second can be seen in Table 4 for different energies. Table 5 shows the analytical results of SNR and CNR values for test objects at various energies with a plane source. Fiber results showed relatively constant SNR and very low CNR. In other words, fiber thickness was not a major differentiating factor. The slight variation was caused by fibers’ shape and low object to background sampling. This was also observed in the masses test objects. However, the analytical results of SNR and CNR values for the micro-calcification (MC) groups are somewhat different. MC results showed more variation of SNR and CNR than in fibers. This is due the higher difference in attenuation between the MC and the acrylic. In General, for MCs higher energy lead to higher SNR and lower CNR. Note that the variations are more prominent for small fibers, MC, and masses due low number of samples compared to the background. The background sampling was about 100 times bigger that the object sampling. This means the surroundings cover a relatively huge area and thus covers more variations which results in higher noise and consequently a decrease in SNR and CNR.
| Energy (keV) | Activity (Ci) | Activity on Image (Ci) | AGD (mGy) |
|---|---|---|---|
| 26 | 0.9 | 0.3 | 0.3 |
| 30 | 0.7 | 0.3 | 0.2 |
| 35 | 0.6 | 0.3 | 0.13 |
| 60 | 0.4 | 0.3 | 0.06 |
Table 3: Dose and activity for different energies (plane source).
| Energy (keV) | Activity (Ci) |
|---|---|
| 26 | 143 |
| 30 | 94 |
| 35 | 79 |
| 60 | 63 |
Table 4: Activity needed at SID = 30 cm and 4 mm disk source to achieve the required gray level value.
| Object | SNR | CNR | |||||||
|---|---|---|---|---|---|---|---|---|---|
| 26 KeV | 30 KeV | 35 KeV | 60 KeV | 26 KeV | 30 KeV | 35 KeV | 60 KeV | ||
| Fiber1 | 46 | 47 | 44 | 46 | 0.01 | -0.08 | -0.16 | -0.24 | |
| Fiber2 | 45 | 46 | 44 | 46 | -0.05 | -0.13 | -0.21 | -0.26 | |
| Fiber3 | 44 | 46 | 45 | 44 | 0.08 | 0.01 | -0.01 | -0.04 | |
| Fiber4 | 45 | 46 | 44 | 44 | 0.01 | -0.02 | -0.04 | -0.08 | |
| Fiber5 | 45 | 46 | 44 | 44 | 0.04 | 0.03 | 0.03 | 0 | |
| Fiber6 | 47 | 47 | 47 | 46 | 0.05 | 0.05 | 0.03 | 0.01 | |
| MC1 | 30 | 37 | 40 | 44 | 2.77 | 2.07 | 1.39 | 0.53 | |
| MC2 | 37 | 41 | 39 | 43 | 2.35 | 1.65 | 1.04 | 0.39 | |
| MC3 | 41 | 37 | 42 | 42 | 1.89 | 1.25 | 0.79 | 0.23 | |
| MC4 | 47 | 46 | 43 | 44 | 1.65 | 1.23 | 0.83 | 0.25 | |
| MC5 | 38 | 54 | 41 | 37 | 0.86 | 0.73 | 0.28 | 0.04 | |
| Mass1 | 45 | 44 | 43 | 43 | 0.42 | 0.21 | 0.08 | -0.07 | |
| Mass2 | 45 | 45 | 44 | 44 | 0.15 | 0.04 | -0.03 | -0.1 | |
| Mass3 | 45 | 46 | 45 | 45 | 0.11 | 0.02 | -0.02 | -0.08 | |
| Mass4 | 45 | 47 | 45 | 46 | 0.05 | -0.01 | -0.04 | -0.1 | |
| Mass5 | 45 | 45 | 45 | 45 | -0.05 | -0.08 | -0.11 | -0.12 | |
Table 5: CNR and SNR values for test objects at various energies (plane source).
Visual assessment
Visual assessment was a guiding tool to indicate how to vary the parameters in the simulations. Enhancement techniques such as field correction and filtering were implemented and the resulted images were easily assessed without the need of adjusting the window and levels on the images. Table 6 shows the assessment of images obtained under ideal conditions where it’s clear that objects detectability declines as energy increases. Only 26, 30, 35 keV passed the assessment. Table 7 shows the visual assessment of the images acquired using the experiments conducted with the plane source. Similarly, the 26, 30, 35 keV passed the assessment criteria. Figure 7 shows the image resulted from a 26 keV plane source where we can see clearly the improvement of image clarity after applying a Gaussian smoothing technique that allows for a more proper assessment. The above results indicate that a source such as Am-241 which emits 60 keV gammas (35.5%) in addition to 26 keV gammas (2.4%) could be utilized in mammography using an energy sensitive detector. Recall that Am-241 has a long half-life (about 432 years), which is a desired feature that allows for low maintenance. This research indicates that with a pure Am-241 of the maximum feasible size must have an activity of around 63 Ci to produce acceptable results. Such activity would result in an average glandular dose of about 1.2 mGy when used with an ideal sensitive detector. The dose would rise with typical mammography detectors as they have about 50% efficiency [16]. Other sources that might be used in mammography are Sn- 119m that has a specific activity of 2200 Ci/g for pure sources. This source emits mainly 24 keV (16%), 25 keV (14%), and 65 keV (0.01%) with a half-life of 293 days. In addition, Hf-172 is another option; it emits 24 keV gammas (20%). Other gammas emitted by the source include 67 keV (5.3%), 81 keV (4.5%), 114 keV (2.6%), and 125 keV (11.3%). The Hf-172 source has a half-life of 1.87 years with a specific activity of about 1100 Ci/g [17].

Figure 7: Original 26 keV ACR mammography like phantom image (upper left), inverted image (upper right), smoothed image (lower left), and inverted smoothed image (lower right).
| Objects | Energy (keV) | |||||
|---|---|---|---|---|---|---|
| 26 | 30 | 35 | 40 | 50 | 60 | |
| Fibers | 6 | 5 | 4 | 2 | 0 | 0 |
| Micro-calcifications | 5 | 5 | 5 | 4 | 4 | 3 |
| Masses | 4 | 3 | 3 | 1 | 1 | 1 |
Table 6: Visual assessment for images obtained under ideal conditions.
| Objects | Energy (keV) | |||
|---|---|---|---|---|
| 26 | 30 | 35 | 60 | |
| Fibers | 4 | 4 | 4 | 0 |
| Micro-calcifications | 4 | 4 | 3 | 3 |
| Masses | 5 | 4 | 3 | 1 |
Table 7: Visual assessment for images obtained with plane source.
Conclusion
This research proved that Gamma radiation mammography was proven to be feasible through Gate simulation. The GATE simulation package was used to define feasibility limits and tested several parameters including energy range, activity, source size and dose. The ACR-like mammography phantom generated in simulation produced gamma images that were assessed visually and analytically. All simulated images were processed and enhanced using an application created by the Visualization Toolkit with a special technique developed to correct for the gamma radiation field inhomogeneity and with a morphological operator based technique was used to extract automatically regions of interest from the simulated images to estimate the contrast and signal-to-noise ratio. This technique eliminated the inter- and intra-user assessment variability. The results of the analytical and visual assessments demonstrated that gamma radiation of 35 keV energy or less produces acceptable mammography images. Higher energy photons produced mammography images but did not pass the rigorous clinical acceptable tests. The maximum feasible cylindrical source size was found to be 4 mm in diameter and 5 mm in thickness. Am-241 source showed to produce acceptable mammography images in simulation with an average glandular dose of 1.2 mGy and energy sensitive detectors. The dose would rise with typical mammography detectors.
References
- Hendee WR,Ritenour ER (2002) Medical Imaging Physics 4th Ed. New York: Wiley-Liss.
- BushbergJ, Anthony SJ, Edwin L, John B (2011) The Essential Physics of Medical Imaging. Lippincott Williams & Wilkins
- Priyada P, Margret M,Ramar R, Menaka M, et al. (2011) Intercomparison of gamma scattering, gammatography, and radiography techniques for mild steel nonuniform corrosion detection. Review of Scientific Instruments.
- Alyassin AM, Hamza AM, Ahmad MM, et al. (2013) Feasibility study of gamma-ray medical radiography. Applied Radiation and Isotopes 72: 16-29.
- Abdul-Majid, Samir, Mohammed K, Abdulraof M, et al. (2010) Am-241 Radioactive Source for Diagnostic Medical Imaging. Tenth Radiation Physics & Protection Conference.
- Duarte IC, Liliana C, Filipe S, et al. (2009) World Congress on Medical Physics and Biomedical Engineering Munich.
- Grabski, Varlen, Maria-Ester B, Ruiz-Trejo C, Yolanda V (2006)PSF, LSF and S/P in mammography: GEANT4 validation. ZeitschriftfÃÆÃâÃâürMedizinischePhysik.
- Vidal, Feijo P (2008)Geant4 validation on mammography applications. Nuclear Science Symposium Conference Record. Dresden, Germany.
- Schroeder W, Kenneth WM, Bill L(1996) The Visualization Toolkit: An Object-oriented Approach to 3-D Graphics.
- Jan S,Santin G,Strul D, Steven S, et al. (2004) GATE: a simulation toolkit for PET and SPECT. Physics in Medicine and Biology 49: 4543-4561.
- Shivaramu, Priyada P,RamarR, Margret M (2011)Digital mammography image simulation using Monte Carlo. 5th Pan American Conference for NDT.
- Fluke Biomedical(2014) ACR mammographic accreditation phantom.
- DeWerd, Larry, Michael K(2013)The Phantoms of Medical and Health Physics. Springer.
- Huda W(2013)Review of Radiologic Physics 3rd Edition. Philadelphia Lippincott Williams & Wilkins, a Wolters Kluwer business.
- Alyassin, Abdalmajeid M (2015) Unsupervised and Precise Tracking of Brain Parenchyma Volume Using Dual Spin Echo T2 Weighted MR Data. Current Medical Imaging Reviews 11: 141-151.
- Pfeiffer, Karl-Friedrich G (2004) Evaluation of the Medipix Detectors for Medical X-Ray Imaging, with Special Consideration of Mammography. University of Erlangen-Nuremberg.
- Johnson TE, Brian KB(2012) Health Physics and Radiological Health 4th Edition. Lippincott Williams & Wilkins

Open Access Journals
- Aquaculture & Veterinary Science
- Chemistry & Chemical Sciences
- Clinical Sciences
- Engineering
- General Science
- Genetics & Molecular Biology
- Health Care & Nursing
- Immunology & Microbiology
- Materials Science
- Mathematics & Physics
- Medical Sciences
- Neurology & Psychiatry
- Oncology & Cancer Science
- Pharmaceutical Sciences